
FIGURE
Fig. S3
Fig. S3
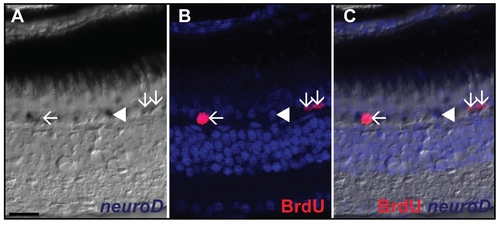
Identification of rod progenitors. A) In situ hybridization of neuroD shows expression in the ONL in one month chase control fish (white arrows). B) BrdU labeling of one month pulse chase fish shows labeling of BrdU in the ONL (white arrows). C) The merged picture shows double labeling of some neuroD+ cells with BrdU (white arrows). neuroD labeled cells which do not colocalize with BrdU are also found in the ONL (white arrowhead). Scale bar = 20 μm. |
Expression Data
Expression Detail
Antibody Labeling
Phenotype Data
Phenotype Detail
Acknowledgments
This image is the copyrighted work of the attributed author or publisher, and
ZFIN has permission only to display this image to its users.
Additional permissions should be obtained from the applicable author or publisher of the image.
Full text @ PLoS One