
FIGURE
Fig. S2
Fig. S2
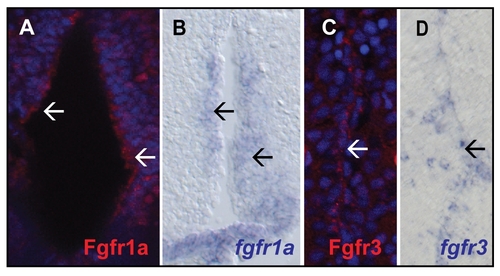
Comparison of Fgfr antibody stainings with in situ hybridizations on telencephalic brain sections of adult zebrafish. A) Fgfr1a staining the ventricle (white arrows) B) In situ hybridization for fgfr1a detectable at the ventricle (black arrows). C) Fgfr3 is expressed in the ventricular zone of the dorsal glia domain (white arrow). D) Similar expression is detected for fgfr3 (black arrow). |
Expression Data
Expression Detail
Antibody Labeling
Phenotype Data
Phenotype Detail
Acknowledgments
This image is the copyrighted work of the attributed author or publisher, and
ZFIN has permission only to display this image to its users.
Additional permissions should be obtained from the applicable author or publisher of the image.
Full text @ PLoS One