Fig. 7
- ID
- ZDB-FIG-110907-12
- Publication
- Cheung et al., 2011 - Visualization, characterization and modulation of calcium signaling during the development of slow muscle cells in intact zebrafish embryos
- Other Figures
- All Figure Page
- Back to All Figure Page
|
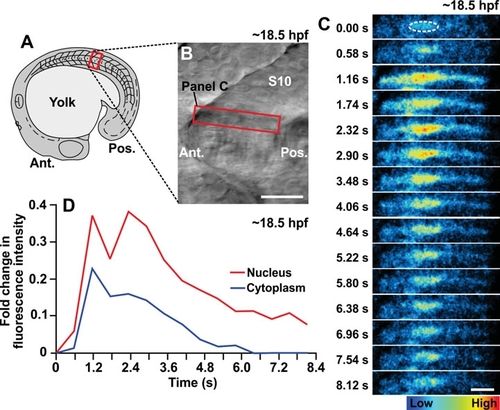
A Ca2+ signal generated in a single muscle cell in the trunk of an intact embryo at ~18.5 hpf (i.e., the 19-somite stage). Embryos (n=3) were loaded with calcium green-1 dextran (10S) at the 1-cell stage and images were acquired via confocal microscopy. (A) Schematic diagram to show the position of somite 10 (red box) in the zebrafish embryo where the Ca2+ signal was acquired. (B) Bright-field image of somite 10 with the position of the imaged cell indicated (see red box). (C) Single confocal sections to show the Ca2+ signal generated in the imaged cell over a period of ~8 s. The images were acquired every ~0.58 sec. The nucleus is outlined with a white dashed line in the first panel. The color scale represents the level of [Ca2+]i, where red indicates a high level and blue indicates a low level. Ant. and Pos. are anterior and posterior, respectively. Scale bars are (B) 25 μm and (C) 10 μm. (D) Temporal profile of the fold change in fluorescence intensity in the nucleus and cytoplasm in this muscle cell for the duration of the Ca2+ signal. |

