
Fig. 7
- ID
- ZDB-FIG-110719-5
- Publication
- Sorokina et al., 2011 - MIP/Aquaporin 0 Represents a Direct Transcriptional Target of PITX3 in the Developing Lens
- Other Figures
- All Figure Page
- Back to All Figure Page
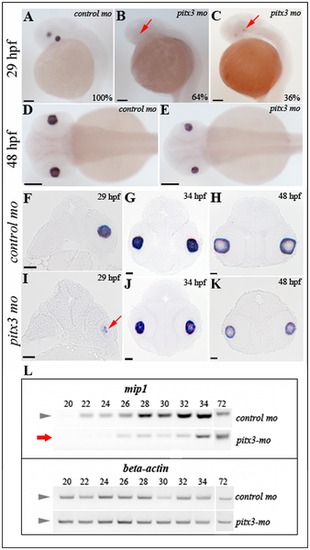
Analysis of mip1 expression in pitx3-mo and control embryos via in situ hybridization and RT-PCR. A, D, F-H. Normal mip1 expression in control-injected embryos at 29-, 34- and 48-hpf. B, C, E, I?K. Altered mip1 expression is observed in pitx3 morphants at 29-hpf with 64% of embryos demonstrating a complete absence of mip1 expression (B) and the remaining larvae showing markedly reduced mip1 expression (C and I). Reduced mip1 expression is also observed in 34- and 48-hpf embryos (E, J, K). Red arrows show sites of expected mip1 expression. Scale bars: A?E: 100 μM; F?L: 20 μM. L. Results of semi-quantitative RT-PCR showing reduced expression of mip1 in pitx3 morphants at early stages of development (red arrow). |
| Gene: | |
|---|---|
| Fish: | |
| Knockdown Reagent: | |
| Anatomical Terms: | |
| Stage Range: | 20-25 somites to Protruding-mouth |