
Fig. 4
- ID
- ZDB-FIG-110712-44
- Publication
- Mönnich et al., 2011 - A zebrafish model of Roberts syndrome reveals that Esco2 depletion interferes with development by disrupting the cell cycle
- Other Figures
- All Figure Page
- Back to All Figure Page
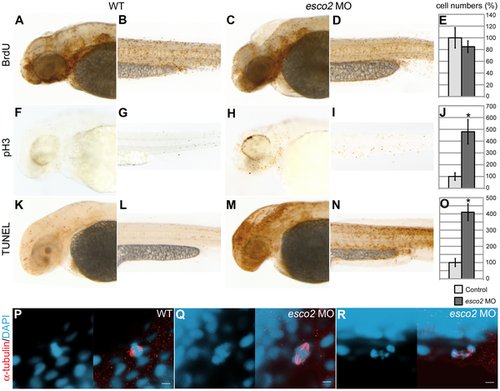
Cell cycle is blocked at mitosis in esco2 morphants. A–E, Cells in S phase stained with BrdU were similar in numbers in wild type (A, B) and esco2 morphant (C, D). Statistical analyses did not show a significant difference in cell numbers in the tails of embryos at 2 dpf (E). F–J, pH3 staining of mitotic cells revealed increased cell numbers in esco2 morphant (H, I) compared to wild type (F, G). The difference in cell numbers is statistically significant (J). K–O, Apoptotic cells labeled with TUNEL were severely increased in esco2 morphants (M, N, compared to wild type in K, L). The difference in cell numbers is statistically significant (O). Lateral views of 2 dpf larval heads (A, F, K, C, H, M) and regions in tail above the yolk sac extension (B, G, L, D, I, N), anterior to the left. An asterisk in the graphs (J, O) indicates a statistically significant difference in cell numbers of esco2 morphants compared with wild type embryos (p-value<0.05). P–R, Confocal images of mitotic cells at 1 dpf stained with anti-α-tubulin (red) and counterstained with DAPI (blue, left panels). Right panels: merged images. In esco2 morphants the DNA was fragmented (P, Q, left panels) and spindles were often disorganized (R, right panel) compared to wild type (P). Scale bar: 5 μm. |
| Fish: | |
|---|---|
| Knockdown Reagent: | |
| Observed In: | |
| Stage: | Long-pec |