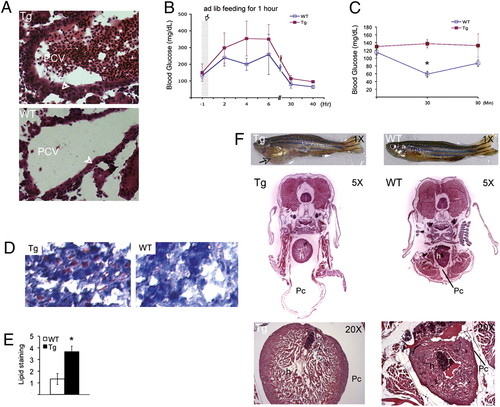
Tg:Pomc-Pttg transgenic zebrafish develop hypercortisolism, exacerbated insulin resistance, glucose intolerance, hepatic steatosis, and cardiomyopathy. (A) Tg:pomc-pttg (Top, Tg) fish showed steroidogenic cell expansion as depicted by H&E stain of kidney head paraffin slides. Zebrafish Gc steroidogenic cells are arranged as epithelial cell layers (arrowheads) in association with the renal head posterior cardinal vein (27). Tg:pomc-pttg fish also showed blood cell accumulation within the posterior cardinal vein, which was not observed in WT (Bottom). (B) Glucose tolerance tests were performed in 72 Tg:pomc-pttg and WT fish. Zebrafish were given ad libitum feeding of regular diet for 1 h (gray column) after 16 h of fasting. Glucose levels are presented as mean � SE (area under the curve; P < 0.0001). (C) After 20 h of fasting, zebrafish were intraperitoneally injected with insulin (0.1 U/100 mg), and blood glucose levels were measured at 30 and 60 min after insulin injection (n = 24, mean � SE; *P < 0.01). (D) Oil red O staining of liver sections reveal hepatic lipid accumulation in Tg:Pomc-pttg transgenic fish. (E) Area distribution and intensity of hepatic oil red O staining were scored as described in SI Methods (mean � SE; *P < 0.01). (F) Top: Tg:Pomc-pttg zebrafish (Tg) with gross pericardial fluid accumulation (arrow) compared with WT at 24 mo. Middle: H&E stain of midbody cross section. Bottom: High magnification (20�) showing ventricular hypertrophy of the heart. Tg, Tg:Pomc-Pttg; Pc, pericardial space; h, heart. (Scale bar, 50 μM.)
|
