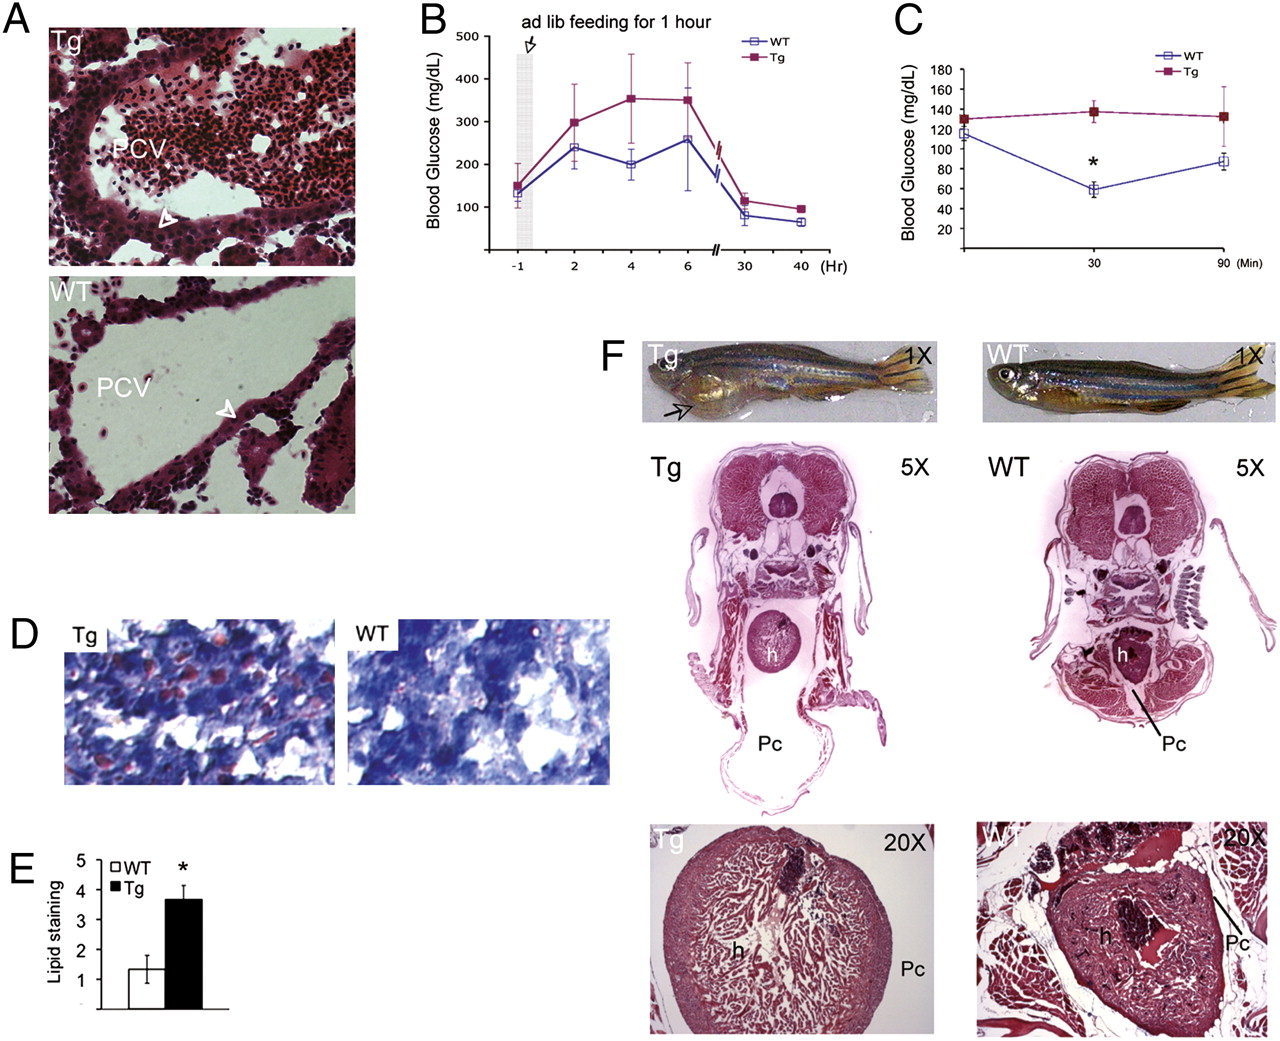
Fig. 2 Tg:Pomc-Pttg transgenic zebrafish develop hypercortisolism, exacerbated insulin resistance, glucose intolerance, hepatic steatosis, and cardiomyopathy. (A) Tg:pomc-pttg (Top, Tg) fish showed steroidogenic cell expansion as depicted by H&E stain of kidney head paraffin slides. Zebrafish Gc steroidogenic cells are arranged as epithelial cell layers (arrowheads) in association with the renal head posterior cardinal vein (27). Tg:pomc-pttg fish also showed blood cell accumulation within the posterior cardinal vein, which was not observed in WT (Bottom). (B) Glucose tolerance tests were performed in 72 Tg:pomc-pttg and WT fish. Zebrafish were given ad libitum feeding of regular diet for 1 h (gray column) after 16 h of fasting. Glucose levels are presented as mean ± SE (area under the curve; P < 0.0001). (C) After 20 h of fasting, zebrafish were intraperitoneally injected with insulin (0.1 U/100 mg), and blood glucose levels were measured at 30 and 60 min after insulin injection (n = 24, mean ± SE; *P < 0.01). (D) Oil red O staining of liver sections reveal hepatic lipid accumulation in Tg:Pomc-pttg transgenic fish. (E) Area distribution and intensity of hepatic oil red O staining were scored as described in SI Methods (mean ± SE; *P < 0.01). (F) Top: Tg:Pomc-pttg zebrafish (Tg) with gross pericardial fluid accumulation (arrow) compared with WT at 24 mo. Middle: H&E stain of midbody cross section. Bottom: High magnification (20×) showing ventricular hypertrophy of the heart. Tg, Tg:Pomc-Pttg; Pc, pericardial space; h, heart. (Scale bar, 50 μM.)
Image
Figure Caption
Figure Data
Acknowledgments
This image is the copyrighted work of the attributed author or publisher, and
ZFIN has permission only to display this image to its users.
Additional permissions should be obtained from the applicable author or publisher of the image.
Full text @ Proc. Natl. Acad. Sci. USA

