
Fig. 1
- ID
- ZDB-FIG-110407-38
- Publication
- Carvalho et al., 2011 - A high-throughput screen for tuberculosis progression
- Other Figures
- All Figure Page
- Back to All Figure Page
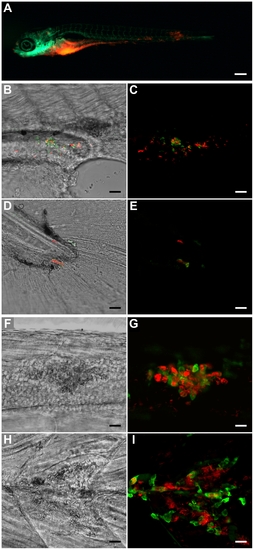
Outcome of M. marinum yolk sac injection of embryos between the 16- and the 512-cell stage. (A) 5 dpi fli1-egfp larva with gfp-labelled vasculature showing spread of bacteria (red) throughout the body (scale bar: 250 μm). (B and D) Bright-field/fluorescence overlay and (C and E) confocal z-stack of red-fluorescent bacteria showing activation of green-fluorescent gags at the (B and C) edge of the yolk extension and on the (D and E) tail of a 7 day-old larva (scale bar: 25 μm). (F and H) Bright-field confocal plane and (G and I) confocal z-stack of red-fluorescent bacteria co-localizing with green-fluorescent leukocytes detected by L-plastin immunostaining (scale bar: 25 μm). The lesions caused by the granulomas can be clearly seen in F and H. |
| Fish: | |
|---|---|
| Condition: | |
| Observed In: | |
| Stage: | Days 7-13 |