
FIGURE
Fig. 3
- ID
- ZDB-FIG-110121-31
- Publication
- Yu et al., 2011 - The Cell Adhesion-associated Protein Git2 Regulates Morphogenetic Movements during Zebrafish Embryonic Development
- Other Figures
- All Figure Page
- Back to All Figure Page
Fig. 3
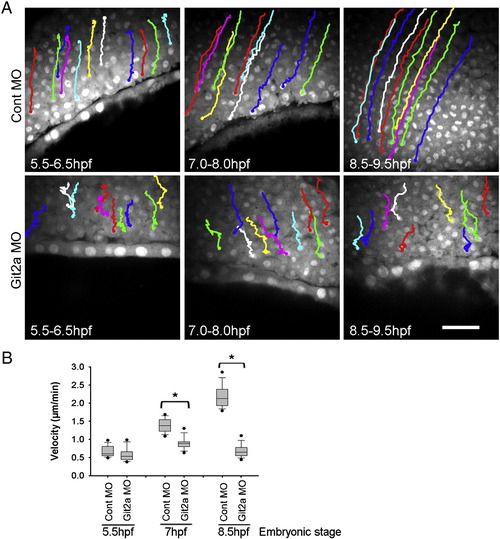
Epiboly cell migration is impaired by Git2a knockdown. (A) Cell tracking images generated from the time-lapse movies of control and Git2a morphants during epiboly. Representative migration paths of deep (epiblast) cells were obtained by tracking cell nuclei at 5.5-6.5 hpf, 7-8 hpf, 8.5-9.5 hpf. Scale bar, 50 �m. (B) Quantification of deep cell migration velocity of control and git2a morphant embryos by Box and Whisker Plot diagrams. For each set, forty cells from three embryos were tracked and measured by ImageJ software. Student′s t-test, *p < 0.005. |
Expression Data
Expression Detail
Antibody Labeling
Phenotype Data
| Fish: | |
|---|---|
| Knockdown Reagent: | |
| Observed In: | |
| Stage Range: | 50%-epiboly to 90%-epiboly |
Phenotype Detail
Acknowledgments
This image is the copyrighted work of the attributed author or publisher, and
ZFIN has permission only to display this image to its users.
Additional permissions should be obtained from the applicable author or publisher of the image.
Reprinted from Developmental Biology, 349(2), Yu, J.A., Foley, F.C., Amack, J.D., and Turner, C.E., The Cell Adhesion-associated Protein Git2 Regulates Morphogenetic Movements during Zebrafish Embryonic Development, 225-237, Copyright (2011) with permission from Elsevier. Full text @ Dev. Biol.