
FIGURE
Fig. S6
- ID
- ZDB-FIG-101119-27
- Publication
- Cao et al., 2009 - Chemical modifier screen identifies HDAC inhibitors as suppressors of PKD models
- Other Figures
- All Figure Page
- Back to All Figure Page
Fig. S6
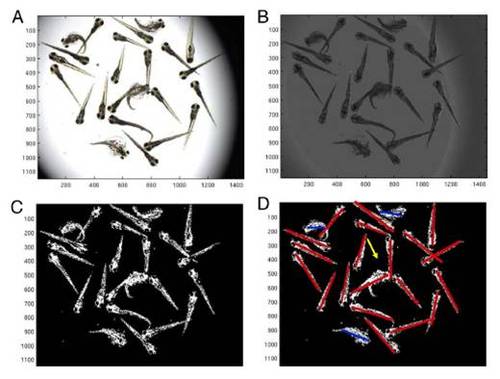
Automated classification of the body curvature phenotype. The original image (A) is first passed trough a classification algorithms trained for separating the fish-pixels from the background. The output (B) is then denoised with a convolutional filter and the result (C) is passed to the detection stage. Fish classified as straight by the program is marked with a red line, while curved is labeled with a blue line (D). A misclassification caused by two fish lumping together can be seen in D (arrow). |
Expression Data
Expression Detail
Antibody Labeling
Phenotype Data
Phenotype Detail
Acknowledgments
This image is the copyrighted work of the attributed author or publisher, and
ZFIN has permission only to display this image to its users.
Additional permissions should be obtained from the applicable author or publisher of the image.
Full text @ Proc. Natl. Acad. Sci. USA