
Fig. S4
- ID
- ZDB-FIG-101119-26
- Publication
- Cao et al., 2009 - Chemical modifier screen identifies HDAC inhibitors as suppressors of PKD models
- Other Figures
- All Figure Page
- Back to All Figure Page
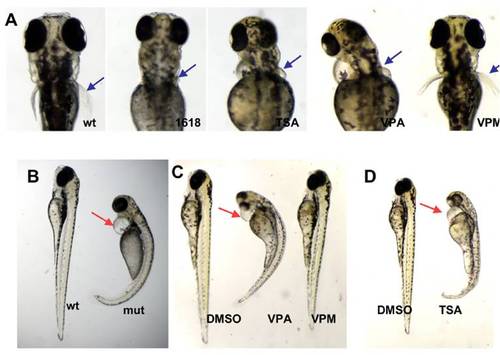
Comparison of phenotypes caused by hdac1 depletion and VPA and TSA treatment. (A) Stunted pectoral fin (blue arrow) development on 3 dpf in a hdac1/hi1618 mutant embryo (1618), a wild-type embryo treated with 300 nM TSA (TSA), 20 μM VPA (VPA), and 50 μm (VPM) from the 30% epiboly stage. (B) Pericardiac edema (red arrow) on 3 dpf in a hdac1/hi1618 mutant embryo. WT: wild-type sibling. mut: hdac1/hi1618 mutant. (C) Treatment of 300 nM TSA from the 30% epiboly stage leads to pericardiac edema (red arrow) on 3 dpf, while similar treatment with 50 μM VPM does not. (D) Treatment of 20 μM TSA from the 30% epiboly stage leads to pericardiac edema (red arrow) on 3 dpf. |