
Fig. 7
- ID
- ZDB-FIG-101111-47
- Publication
- Prykhozhij, 2010 - In the Absence of Sonic Hedgehog, p53 Induces Apoptosis and Inhibits Retinal Cell Proliferation, Cell-Cycle Exit and Differentiation in Zebrafish
- Other Figures
- All Figure Page
- Back to All Figure Page
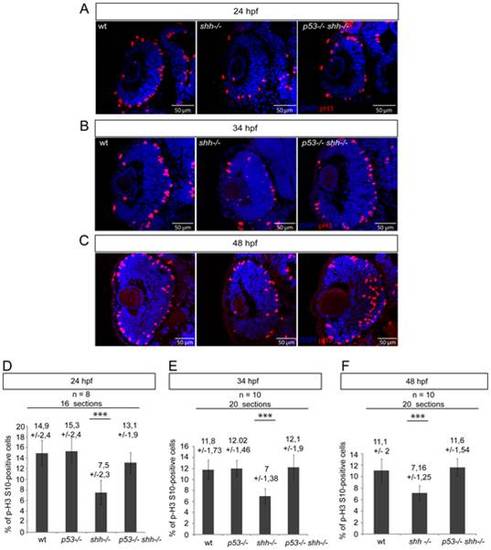
pH 3/DAPI staining of wild-type, shh-/- and p53-/-shh-/- retinas was done at 24 hpf (A), 34 hpf (B) and 48 hpf (C). At all stages, the mitotic index in the shh-/- retina was lower than in the wild-type retina, while in the p53-/-shh-/- retina, the mitotic index was comparable to that of the wild-type retina. (D) Statistical analysis of mitotic indices in wild-type, p53-/-, shh-/- and p53-/-shh-/- retinas at 24 hpf, the indices being comparable in wild-type (14,9%, SD = 2,4%), p53-/- (15,3%, SD = 2,4%), and p53-/-shh-/- (13,1%, SD = 1,9%) embryos and significantly higher than in the shh-/- mutant retina (7,5%, SD = 2,3%). (E) Statistical analysis of mitotic indices in the wild-type, p53-/-, shh-/- and p53-/-shh-/- retinas at 34 hpf, comparable in wild-type (11,8%, SD = 1,73%), p53-/- (12,02%, SD = 1,46%), and p53-/-shh-/- (12,1%, SD = 1,9%) retinas, whereas the mitotic index in the shh-/- mutant retina was almost twice lower (7%, SD = 1,38%). (F) Statistical analysis of mitotic indices in wild-type, shh-/- and p53-/-shh-/- retinas at 48 hpf, the indices being comparable in wild-type (11,1%, SD = 2%) and p53-/-shh-/- (11,6%, SD = 1,54%) embryos and significantly higher than in the shh-/- mutant retina (7,16%, SD = 1,25%). Either 8 (D) or 10 (E, F) embryos (2 retinal sections per embryo) were analysed for each genotype and mean +/- standard deviation indicated above the bars of mitotic index statistics. Asterisks (***) on top of shh-/- mutant bars indicate their significant statistical differences from other samples (t-test, P-value<0,001). |