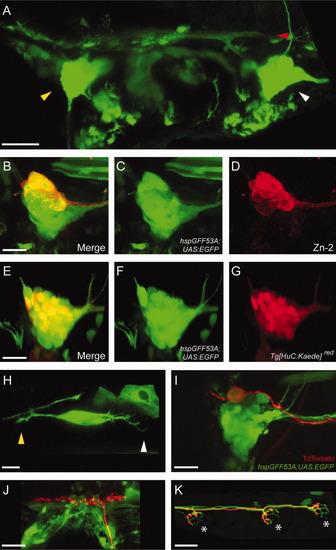
Characterization of the hspGFF53A transgenic line. A: EGFP expression pattern in a hspGFF53A;UAS:EGFP transgenic fish at 48 hpf. The image focuses on the otic region. Yellow and white arrowheads indicate the anterior and posterior lateralis ganglia, respectively. Red arrowhead indicates lateralis′ central projections. B-D: hspGFF53A;UAS:EGFP posterior ganglion immunostained with the Zn-2 monoclonal antibody at 60 hpf. B: Merge of the EGFP (C) and Zn-2 (D) fluorescent signals. Somata positive for hspGFF53A;UAS:EGFP and Zn-2 are seen as yellow; Zn-2(-) somata appear only green. E-G: Posterior lateralis ganglion from a Tg[HuC:Kaede];hspGFF53A;UAS:EGFP triple transgenic fish at 60 hpf. E: Merge of the EGFP (F) and Tg[HuC:Kaede]red (G) fluorescent signals. Somata positive for hspGFF53A;UAS:EGFP and Tg[HuC:Kaede]red are seen as yellow; Tg[HuC:Kaede]red (-) somata appear only green. H: EGFP expression in a hspGFF53A;UAS:EGFP posterior ganglion at 22 hpf. Yellow and white arrowheads indicate the central and peripheral axons, respectively. I-K: Three-day-old hspGFF53A;UAS:EGFP fish injected with DNA coding for mem-TdTomato under the transcriptional control of a UAS. The soma (I), central (J), and peripheral projection (K) of a single mem-TdTomato-labeled lateralis afferent neuron is shown in red, whereas the EGFP(+) cells are green. Asterisks in K indicate the neuromasts innervated by the Tdtomato(+) neuron. All images are maximal projections and lateral views. Dorsal is towards top, anterior is towards left. Scale bars = 40 μm (A), 30 μm (J,K), and 20 μm (B,E,H,I).
|
