- Title
-
Progressive neurogenesis defines lateralis somatotopy
- Authors
- Pujol-Martí, J., Baudoin, J.P., Faucherre, A., Kawakami, K., and Lopez-Schier, H.
- Source
- Full text @ Dev. Dyn.
|
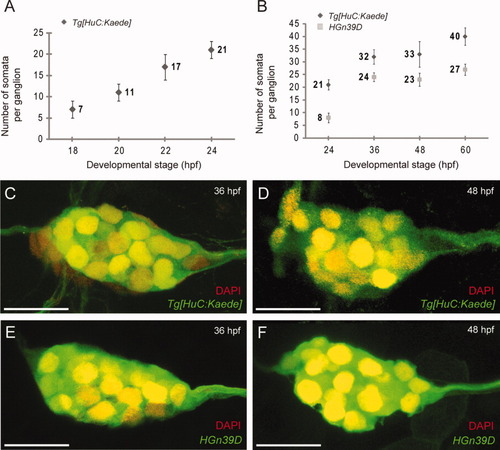
Progressive neurogenesis in the posterior lateralis ganglion. A: Average number of somata per posterior lateralis ganglion in the Tg[HuC:Kaede] transgenic line from 18 to 24 hpf, with a temporal resolution of 2 h (N=10). B: Comparison of the number of somata per posterior lateralis ganglion in the Tg[HuC:Kaede] and HGn39D transgenic lines, from 24 to 60 hpf, with a temporal resolution of 12 hr (N=4). Both show a progressive addition of neurons to the ganglion. Error bars indicate standard deviation. C-F: Maximal projections of Tg[HuC:Kaede] and HGn39D ganglia at 36 and 48 hpf. Tg[HuC:Kaede]green (C,D) and EGFP (E,F). Co-localization of the green and DAPI staining (red) signals fluoresces yellow. All images are lateral views. Dorsal is up, anterior is left. Scale bars = 20 μm. |
|
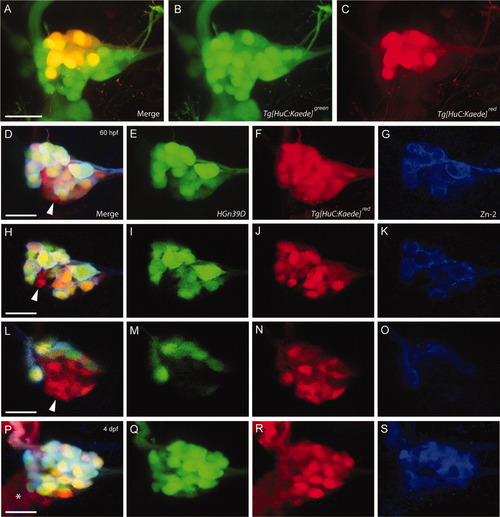
Simultaneous analysis of lateralis afferent neuron differentiation time and location in the posterior lateralis ganglion. A-C: Maximal projection of a Tg[HuC:Kaede] posterior lateralis ganglion at 60 hpf resulting from a BAPTI experiment conducted at 24 hpf. A: Merge of Tg[HuC:Kaede]green (B) and Tg[HuC:Kaede]red (C) signals. Early-differentiating neurons (converted at 24 hpf) are green and red (yellow), whereas late-differentiating neurons appear only green. D-G: Maximal projection of a posterior lateralis ganglion from a Tg[HuC:Kaede]red;HGn39D double transgenic fish at 60 hpf immunostained with the monoclonal antibody Zn-2. Confocal sections of a lateral (H-K) and a medial (L-O) plane of the same ganglion shown in D-G. P-S: Posterior lateralis ganglion from a Tg[HuC:Kaede]red;HGn39D double transgenic fish at 4 dpf immunostained with Zn-2. D,H,L,P: Merge of EGFP (E,I,M,Q), Tg[HuC:Kaede]red (F,J,N,R), and Zn-2 (blue) (G,K,O,S) fluorescent signals. The posterior lateralis ganglion was exposed to 405 nm light before image acquisition in order to convert all the Tg[HuC:Kaede]greento Tg[HuC:Kaede]red. This allowed us to distinguish the HGn39D(+) neurons (green) from the Tg[HuC:Kaede](+) neurons (red). White arrowheads indicate neuronal somata, which are only Tg[HuC:Kaede]red. Asterisk in P indicates the vagus ganglion, highlighted in Tg[HuC:Kaede] but not in HGn39D transgenic fish. All images are lateral views. Dorsal is up, anterior is left. Scale bars = 20 μm. |
|
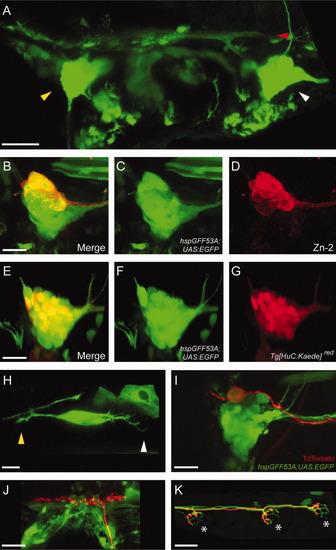
Characterization of the hspGFF53A transgenic line. A: EGFP expression pattern in a hspGFF53A;UAS:EGFP transgenic fish at 48 hpf. The image focuses on the otic region. Yellow and white arrowheads indicate the anterior and posterior lateralis ganglia, respectively. Red arrowhead indicates lateralis′ central projections. B-D: hspGFF53A;UAS:EGFP posterior ganglion immunostained with the Zn-2 monoclonal antibody at 60 hpf. B: Merge of the EGFP (C) and Zn-2 (D) fluorescent signals. Somata positive for hspGFF53A;UAS:EGFP and Zn-2 are seen as yellow; Zn-2(-) somata appear only green. E-G: Posterior lateralis ganglion from a Tg[HuC:Kaede];hspGFF53A;UAS:EGFP triple transgenic fish at 60 hpf. E: Merge of the EGFP (F) and Tg[HuC:Kaede]red (G) fluorescent signals. Somata positive for hspGFF53A;UAS:EGFP and Tg[HuC:Kaede]red are seen as yellow; Tg[HuC:Kaede]red (-) somata appear only green. H: EGFP expression in a hspGFF53A;UAS:EGFP posterior ganglion at 22 hpf. Yellow and white arrowheads indicate the central and peripheral axons, respectively. I-K: Three-day-old hspGFF53A;UAS:EGFP fish injected with DNA coding for mem-TdTomato under the transcriptional control of a UAS. The soma (I), central (J), and peripheral projection (K) of a single mem-TdTomato-labeled lateralis afferent neuron is shown in red, whereas the EGFP(+) cells are green. Asterisks in K indicate the neuromasts innervated by the Tdtomato(+) neuron. All images are maximal projections and lateral views. Dorsal is towards top, anterior is towards left. Scale bars = 40 μm (A), 30 μm (J,K), and 20 μm (B,E,H,I). EXPRESSION / LABELING:
|
|
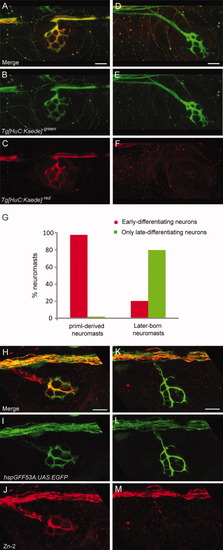
Simultaneous analysis of lateralis afferent neuron differentiation time and peripheral target. A-F: Innervation of neuromast 3 from the first primordium (N3primI) (A-C) and neuromast 1 from the second primordium (N1primII) (D-F) from a photoconverted Tg[HuC:Kaede] transgenic fish. The photoconversion of Kaede was done at 25 hpf. A,D: Merge of Tg[HuC:Kaede]green (B,E) and Tg[HuC:Kaede]red (C,F) fluorescent signals. Early-differentiating neurons (photoconverted at 25 hpf) are yellow. Late-differentiating neurons appear only green. G: Percentage of primI-derived neuromasts (N=52) and later-born neuromasts (N=20) innervated by either Tg[HuC:Kaede]red neurons (early-differentiating, in red) or only Tg[HuC:Kaede]green neurons (late-differentiating, in green). H-M: Innervation of N1primI (H-J) and N1primII neuromasts (K-M) from a hspGFF53A;UAS:EGFP double-transgenic fish immunostained with Zn-2 MAb. H,K: Merge of EGFP (I,L) and Zn-2 (J,M) fluorescent signals. Neurons positive for hspGFF53A- and Zn-2 are green and red (yellow). Zn-2(-) neurons appear only green. All images were taken at 72 hpf, and are maximal projections and lateral views. Dorsal is towards top, anterior is towards left. Scale bars = 10 μm. EXPRESSION / LABELING:
|
|
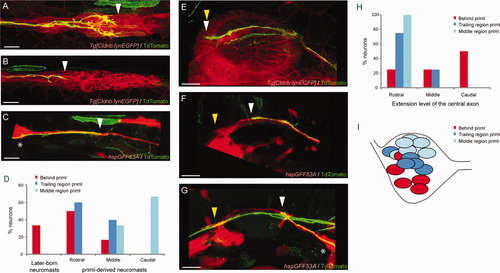
Analysis of single lateralis afferent neurons. A-C, E-G: Single neurons labeled with mem-TdTomato. Eggs of Tg[CldnB:lynEGFP] or hspGFF53A;UAS:EGFP transgenic animals (red) were injected with HuC:mem-TdTomato (green). A-C: Peripheral projections of single labeled neurons at ∼27 hpf. White arrowheads indicate the position of the growth cone: middle region of primI (A), trailing region of primI (B), or behind primI (C). EGFP fluorescent signal shows the moving posterior primordium in A and B. Growth cones that do not touch the primordium are not arborized (C). Asterisk in C indicates the posterior lateralis ganglion. D: Percentage of neurons with growth cones in the middle region of primI (light blue), trailing region of primI (dark blue), or behind primI (red), which show different neuromast selection at 3.5 dpf. E-G: Central projections of single labeled neurons at ∼27 hpf. White arrowheads indicate the position of the hindbrain reached by the mem-TdTomato-labeled neurons: rostral (E), middle (F), or caudal (G). Yellow arrowheads indicate the position of the hindbrain reached by the EGFP(+) neurons. Asterisk in G indicates the posterior lateralis ganglion. H: Percentage of neurons with growth cones in the middle region primI, trailing region primI, or behind primI, which show a different extension of the central projection at ∼27 hpf. I: Somata location in the posterior lateralis ganglion at 3.5 dpf of mem-TdTomato-labeled neurons of the 3 types: growth cones in the middle region primI, trailing region primI, or behind primI. All images are maximal projections and lateral views. Dorsal is towards top, anterior is towards left. Scale bars = 30 μm (E-G), 20 μm (A-C). EXPRESSION / LABELING:
|
|
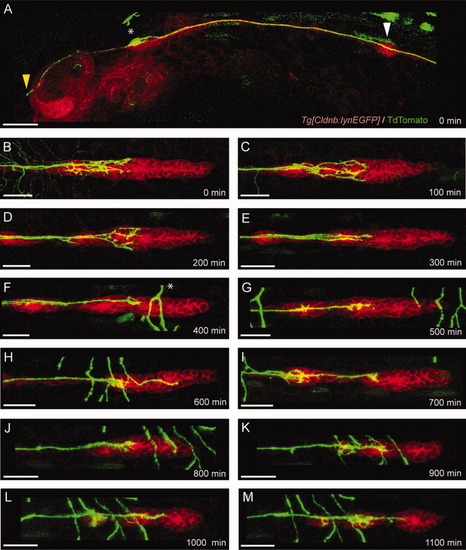
Growth cone morphology over time. A-M: Single lateralis afferent neuron labeled by HuC:mem-TdTomato injection is depicted in green. Asterisk in F indicates other mem-TdTomato-labeled neurons, also shown in green. EGFP fluorescent signal from Tg[CldnB:lynEGFP] transgenic line is shown in red. A: Asterisk and yellow arrowhead indicate the soma and the central projection, respectively. White arrowhead indicates the peripheral projection at the level of neuromast 1. Image acquired at ∼30 hpf. B-M: Growth cone of the neuron depicted in A. Images were taken from ∼30 hpf (B) until ∼48 hpf (M) every 100 min. All images are maximal projections and lateral views. Dorsal is towards top, anterior is towards left. Scale bars = 60 μm (A), 30 μm (B-M). |
|
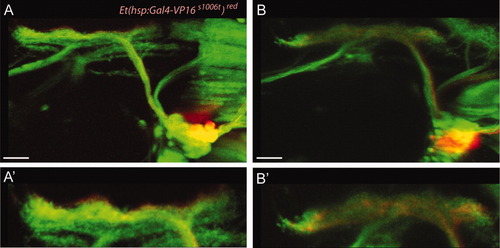
Analysis of lateralis somata ganglionar location and their central projections. A,B: Merge of green- and red-Kaede fluorescent signals. Photoconversion from green- to red-Kaede was performed in dorsally (A) or ventrally (B) located somata in 4-day-old fish from the Et(hsp:Gal4-VP16s1006t);UAS:Kaede double-transgenic line. A′: Detail of the central projections in A. B′: Detail of the central projections in B. All images are maximal projections and lateral views. Dorsal is towards top, anterior is towards left. Scale bar =30 μm. EXPRESSION / LABELING:
|
|
A-C: Somata location in the posterior lateralis ganglion at 3.5 dpf of mem-TdTomato labeled neurons (green) with growth cones in the middle region of primI (A), trailing region of primI (B) or, behind primI (C). The red fluorescent signal is from Tg[CldnB:lynEGFP] transgenic line. All images are snapshots of the lateral view from three-dimensional reconstructions. Dorsal is towards top, anterior is towards left. Scale bars = 20 μm. |
|
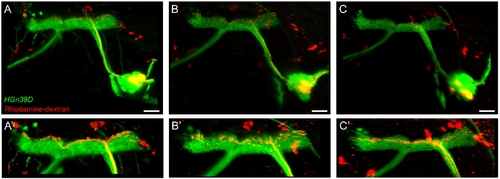
A-C: Somata and central projections of neurons innervating: caudal (Nterm) (A), middle (N4) (B), and rostral (N1) (C) neuromasts, after rhodamine-dextran injection in a 6-day-old HGn39D transgenic fish. EGFP and rhodamine-dextran fluorescent signal are depicted in green and red respectively. A′-C′: Detail of the central projections shown in A-C. Rhodamine-dextran levels were increased to highlight the lateralis central axons. All images are snapshots of lateral views from three-dimensional reconstructions. Dorsal is towards top, anterior is towards left. Scale bars = 30 μm. |

