
FIGURE
Fig. 3
- ID
- ZDB-FIG-100302-20
- Publication
- Yoder et al., 2010 - Developmental and tissue-specific expression of NITRs
- Other Figures
- All Figure Page
- Back to All Figure Page
Fig. 3
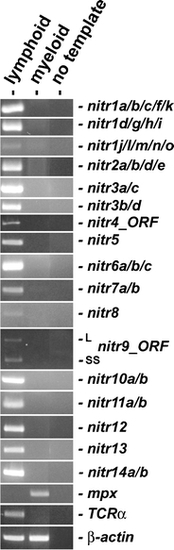
RT-PCR analyses of NITR gene expression from different leukocyte populations. Lymphoid and myeloid cell populations were purified from the kidney of multiple zebrafish and pooled as described (Yoder et al. 2007). RT-PCR was performed as described in Fig. 2, except 1 μg of total RNA was used in the reverse transcription reaction. RT-PCR of myeloperoxidase (mpx) provides a positive control for myeloid cells and TCR-α provides a positive control for T lymphocytes. β-actin is shown as a standard reference. Primer sequences and thermal cycling parameters are listed in Table 1 |
Expression Data
| Genes: | |
|---|---|
| Fish: | |
| Anatomical Terms: | |
| Stage: | Adult |
Expression Detail
Antibody Labeling
Phenotype Data
Phenotype Detail
Acknowledgments
This image is the copyrighted work of the attributed author or publisher, and
ZFIN has permission only to display this image to its users.
Additional permissions should be obtained from the applicable author or publisher of the image.
Open Access.
Full text @ Immunogenetics