FIGURE
Fig. S3
Fig. S3
|
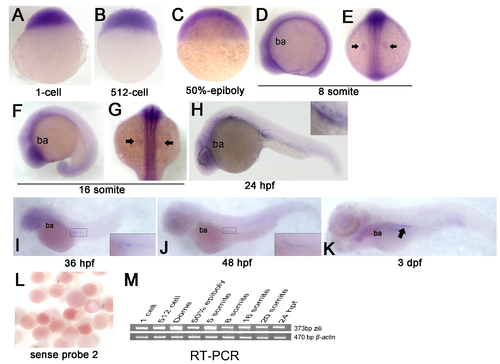
Expression of zili mRNA in zebrafish embryos at indicated stages. (A-K) Detection by whole-mount ISH (Probe 2). Embryo orientations: (A?C) lateral views with the animal pole oriented at the top; (E and G) dorsal views with anterior oriented at the top; (D, F, H-K) lateral views with anterior oriented toward the left. The indicated domains: ba, branchial and pharyngeal arches. PGCs are indicated by arrow in (E, G and K) and enlarged in the insert in (H-J). (L) Embryos detected by sense probe 2. (M) RT-PCR detection of zili expression during early embryogenesis, β-actin as positive control. |
Expression Data
| Gene: | |
|---|---|
| Fish: | |
| Anatomical Terms: | |
| Stage Range: | 1-cell to Protruding-mouth |
Expression Detail
Antibody Labeling
Phenotype Data
Phenotype Detail
Acknowledgments
This image is the copyrighted work of the attributed author or publisher, and
ZFIN has permission only to display this image to its users.
Additional permissions should be obtained from the applicable author or publisher of the image.
Open Access.
Full text @ J. Biol. Chem.

