
FIGURE
Fig. 4
- ID
- ZDB-FIG-100114-18
- Publication
- Anelli et al., 2009 - Global repression of cancer gene expression in a zebrafish model of melanoma is linked to epigenetic regulation
- Other Figures
- All Figure Page
- Back to All Figure Page
Fig. 4
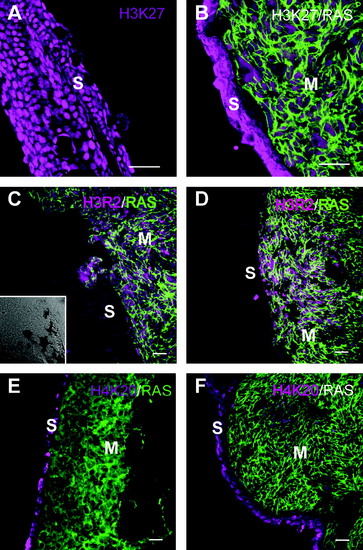
(A) Confocal image of single scans through sections of a wild-type control fin stained for H3K27me3 in magenta. (B?F) Confocal images of single scans through sections with tumors stained for different histone marks (as indicated on top right corner) in magenta. Inset in (C) shows the same section imaged with Normaski optics for orientation. M, melanoma tissue fluorescing in green because it expresses eGFP:HRAS_G12V; S, normal skin. Scale bars = 20μm. |
Expression Data
Expression Detail
Antibody Labeling
Phenotype Data
Phenotype Detail
Acknowledgments
This image is the copyrighted work of the attributed author or publisher, and
ZFIN has permission only to display this image to its users.
Additional permissions should be obtained from the applicable author or publisher of the image.
Full text @ Zebrafish