
Fig. 5
- ID
- ZDB-FIG-090817-49
- Publication
- Curran et al., 2009 - Foxd3 Controls Melanophore Specification in the Zebrafish Neural Crest by Regulation of Mitf
- Other Figures
- All Figure Page
- Back to All Figure Page
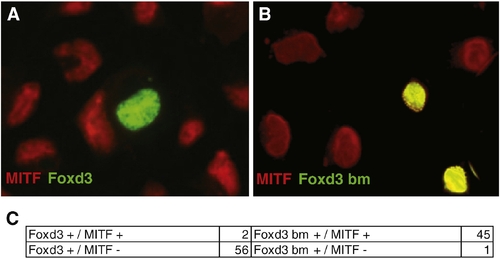
Melb-a cell culture analysis displays Foxd3 repression of endogenous MITF expression. (A, B) Transfected melb-a (mouse melanoblast) cells, (20x). Red: anti-MITF rabbit polyclonal, green: anti-Myc mouse monoclonal. (A) Cells transfected with full-length zebrafish foxd3-myc sequence show nuclear exclusion of endogenous mouse MITF. (B) Cells transfected with DNA-binding mutant version of zebrafish foxd3-myc display co-localized staining with endogenous mouse MITF. (C) Cell counts collected from 5 separate transfection experiments. 56 melb-a cells transfected with full-length foxd3 became MITF negative, 2 remained positive. 1 melb-a cell transfected with DNA-binding mutant version of zebrafish foxd3 became MITF negative, 45 transfected cells remained positive. |
Reprinted from Developmental Biology, 332(2), Curran, K., Raible, D.W., and Lister, J.A., Foxd3 Controls Melanophore Specification in the Zebrafish Neural Crest by Regulation of Mitf, 408-417, Copyright (2009) with permission from Elsevier. Full text @ Dev. Biol.