
FIGURE
Fig. S3
Fig. S3
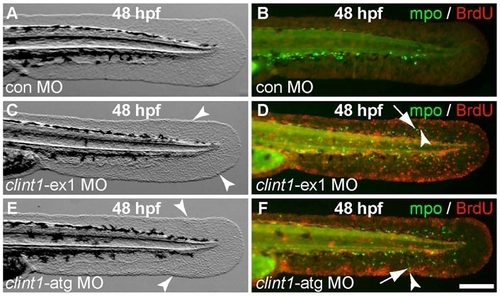
clint1-specific MOs phenocopy hi1520 mutant phenotypes. Standard control MO (con MO) (A,B), clint1-ex1 MO (C,D) or clint1-atg MO (E,F) injected wild-type embryos immunolabeled at 48 hpf for Mpo (green) and BrdU incorporation (red). Arrowheads identify epidermal aggregates (C,E) and proliferative cells (D,F), and arrows identify neutrophils (D,F). Scale bar: 200 μm. |
Expression Data
Expression Detail
Antibody Labeling
Phenotype Data
Phenotype Detail
Acknowledgments
This image is the copyrighted work of the attributed author or publisher, and
ZFIN has permission only to display this image to its users.
Additional permissions should be obtained from the applicable author or publisher of the image.
Full text @ Development