Fig. 7
|
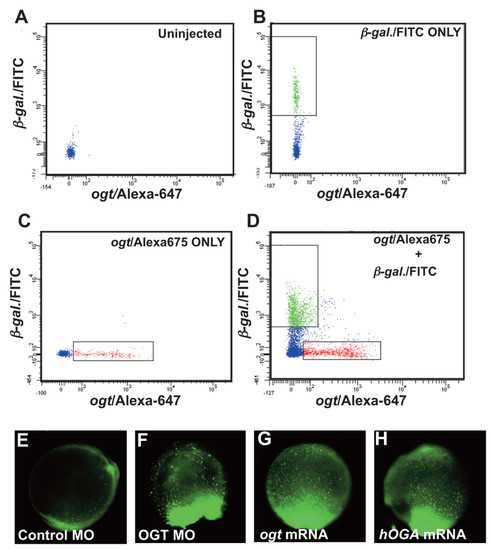
Altering O-GlcNAc levels causes increased cell death. Flow cytometry of dissociated cells from 18 hpf embryos. (A) Distribution of cells from uninjected embryos showing the position of non-fluorescent cells and debris. (B) Distribution of cells from embryos injected with β-galactosidase mRNA/FITC-dextran. The box indicates FITC positive cells between 5?10 μm in diameter. (C) Distribution of cells from embryos injected with variant 4 ogta mRNA/AlexaFluor-647-dextran. The box indicates AlexaFluor-647 positive cells between 5?10 μm in diameter. (D) Embryos injected with β-galactosidase mRNA/FITC-dextran and variant 4 ogta mRNA/AlexaFluor-647-dextran were mixed, dissociated, and fluorescent cells between 5?10 μm diameter were counted. In this experiment, we counted 67,711 FITC positive cells and 43,213 AlexaFluor-647 positive cells. (E-H) Images of live 10 hpf embryos stained with acridine orange, which labels dying cells. All embryos are oriented with the tailbud at the bottom of the panel. (E) In controls, only a few acridine orange positive cells are detected, indicating a low rate of cell death. By contrast, a large number of acridine orange positive cells are observed in ogt morphants (F), Ogt overexpressing embryos (G) and hOga overexpressing embryos (H), indicating a high rate of cell death. |

