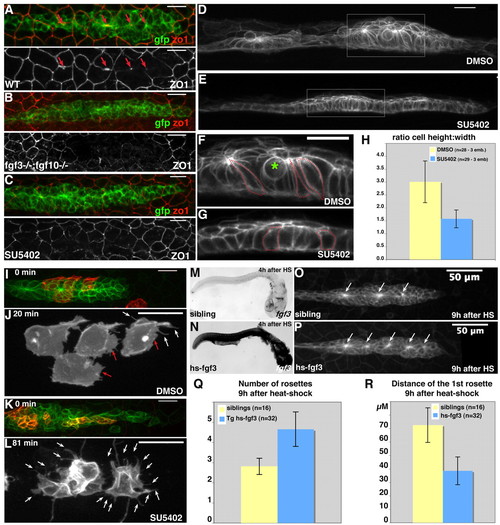
FGF signaling nucleates rosette assembly via a radial epithelialization process. (A-C) Immunostainings with GFP and ZO-1 antibodies in wild type (A), fgf3;fgf10 double mutants (B) and SU5402-treated embryos (C). Although ZO-1 is highly expressed in the centre of rosettes in wild-type primordia (arrows), it is completely absent from primordia lacking FGF activity. (D-H) Cells lacking FGF signaling are flatter and wider than control primordial cells. Confocal images show the primordium from the side in DMSO (D,F), and in SU5402 (E,G). F and G are close-up views of the boxed area in D and E; D and E are maximal projections, F and G are single z-planes. Red dashed lines outline single cell contour and the green star shows a rounded dividing cell (F,G). (H) Quantification of the cellular height:width ratio measured for 28 DMSO-treated (yellow) and 29 SU5402-treated (blue) cells from three different embryos in each case. This shows that cells deprived of FGF signaling have a rather cuboidal shape, whereas control cells have a columnar shape. (I-L) Confocal images of primordium showing single-cell behaviour in mosaic wild-type primordia exposed to DMSO (I,J) or to 5 μM SU5402 (K,L). Red and white arrows (J,L) point to lamellipodia and filopodia, respectively. (M-R) Global activation of fgf3 expression under the control of a heat-shock promoter. (M,N) fgf3 ISH 4 hours after heat shock of a sibling non-transgenic (M) and a hsp70:fgf3 (N) embryo. (O,P) Live pictures of a sibling (O) and hsp70:fgf3 (P) cldnb:gfp embryos 9 hours after heat shock. (Q,R) Quantification of the number of rosettes (Q) and the distance between the centre of the first rosette and the tip of the primordium (R) 9 hours after heat shock, showing that ectopic rosettes form in the leading region of the heat-shocked hsp70:fgf3 primordium. Scale bars: 20 μm (unless stated otherwise).
|

