
Fig. 2
- ID
- ZDB-FIG-080424-78
- Publication
- Lawson et al., 2002 - In vivo imaging of embryonic vascular development using transgenic zebrafish
- Other Figures
- All Figure Page
- Back to All Figure Page
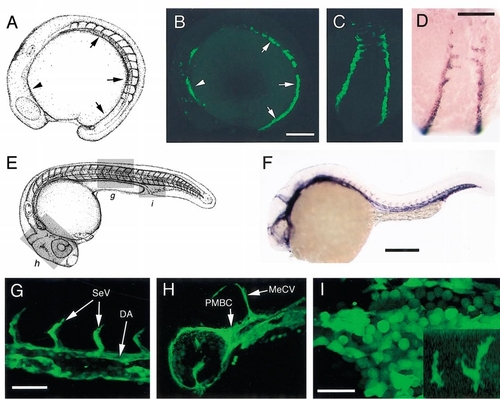
EGFP expression in live TG(fli1:EGFP)y1 embryos. (A) Camera lucida drawing (modified from Kimmel et al., 1995) of a zebrafish embryo at 14 hpf. Arrowhead indicates region of anterior lateral mesoderm and arrows indicate posterior lateral mesoderm shown in (B). (B) Expression of EGFP within the anterior (arrowhead) and posterior (arrows) lateral mesoderm of a 12-somite-stage TG(fli1:EGFP)y1 embryo; lateral view, anterior is to the left. (C) Dorsal view of posterior lateral mesoderm in the embryo shown in (B). (D) Dorsal view of 12-somite-stage embryo stained by in situ hybridization with Fli1; same view as (C). (E) Camera lucida drawing (modified from Kimmel et al., 1995) of a zebrafish embryo at 24 hpf. Boxed regions indicate views in (G?I). (F) Lateral view of 24-hpf embryo stained for in situ hybridization with Fli1; same view as (E). (G?I) Lateral views, anterior is to the left, dorsal is up; images obtained using mulitphoton laser microscopy. (G) EGFP expression in trunk vessels at 24 hpf, including the dorsal aorta (DA) and segmental vessels (SeV). (H) EGFP expression in the major vessels of the head of a TG(fli1:EGFP)y1 embryo at 24 hpf; midcerebral vein (MCeV) and primordial midbrain channel (PMBC) are indicated. (I) EGFP expression in primitive erythroid progenitors within the caudal vein of a 24-hpf TG(fli1:EGFP)y1 embryo and cells with macrophage morphology on the yolk sac (inset). Scale bar, (B, C, D, F) 200 μm; (G, H) 50 μm; (I) 25 μm. |
Reprinted from Developmental Biology, 248(2), Lawson, N.D. and Weinstein, B.M., In vivo imaging of embryonic vascular development using transgenic zebrafish, 307-318, Copyright (2002) with permission from Elsevier. Full text @ Dev. Biol.