- Title
-
In vivo imaging of embryonic vascular development using transgenic zebrafish
- Authors
- Lawson, N.D. and Weinstein, B.M.
- Source
- Full text @ Dev. Biol.
|
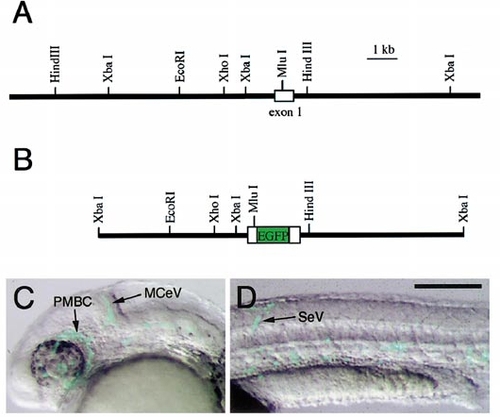
Structure of fli1 5′ genomic region and injection construct. (A) Restriction map of the genomic region surrounding the first exon of zebrafish fli1. (B) Restriction map of the fli1 genomic fragment and EGFP transgene in the pfli15EGFP construct used for injection and establishment of transgenic lines. (C, D) Merged transmitted light and fluorescent images of live embryos injected with linearized pfli15EGFP at 26 hpf; lateral views, anterior is to the left, dorsal is up. (C) EGFP expression within the primordial midbrain channel (PBMC) and midcerebral vein (MCeV) in the head of an injected embryo. (D) EGFP expression in a segmental vessel (SeV). Scale bar, 200 μm. |
|
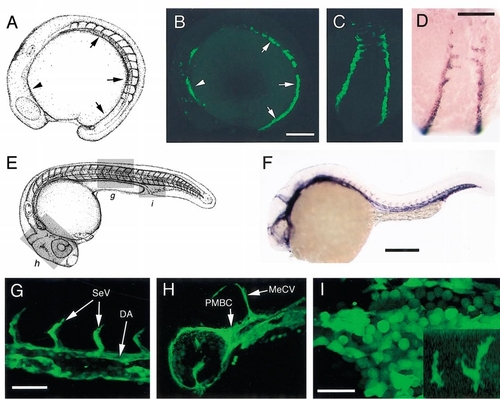
EGFP expression in live TG(fli1:EGFP)y1 embryos. (A) Camera lucida drawing (modified from Kimmel et al., 1995) of a zebrafish embryo at 14 hpf. Arrowhead indicates region of anterior lateral mesoderm and arrows indicate posterior lateral mesoderm shown in (B). (B) Expression of EGFP within the anterior (arrowhead) and posterior (arrows) lateral mesoderm of a 12-somite-stage TG(fli1:EGFP)y1 embryo; lateral view, anterior is to the left. (C) Dorsal view of posterior lateral mesoderm in the embryo shown in (B). (D) Dorsal view of 12-somite-stage embryo stained by in situ hybridization with Fli1; same view as (C). (E) Camera lucida drawing (modified from Kimmel et al., 1995) of a zebrafish embryo at 24 hpf. Boxed regions indicate views in (G?I). (F) Lateral view of 24-hpf embryo stained for in situ hybridization with Fli1; same view as (E). (G?I) Lateral views, anterior is to the left, dorsal is up; images obtained using mulitphoton laser microscopy. (G) EGFP expression in trunk vessels at 24 hpf, including the dorsal aorta (DA) and segmental vessels (SeV). (H) EGFP expression in the major vessels of the head of a TG(fli1:EGFP)y1 embryo at 24 hpf; midcerebral vein (MCeV) and primordial midbrain channel (PMBC) are indicated. (I) EGFP expression in primitive erythroid progenitors within the caudal vein of a 24-hpf TG(fli1:EGFP)y1 embryo and cells with macrophage morphology on the yolk sac (inset). Scale bar, (B, C, D, F) 200 μm; (G, H) 50 μm; (I) 25 μm. |
|
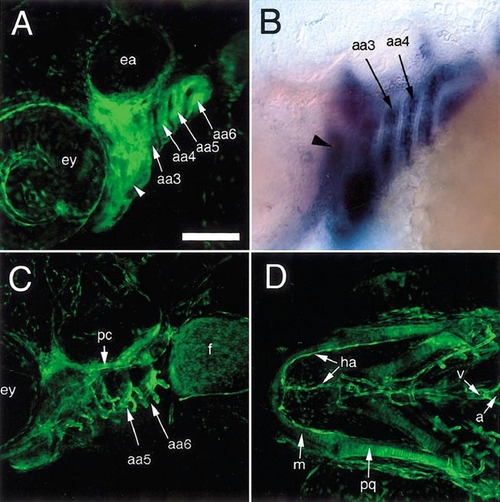
EGFP expression in cranial neural crest derivatives in TG(fli1:EGFP)y1; albb4 embryos. (A?C) Lateral views, anterior is to the left, dorsal is up. (A) Live 2-dpf embryo expressing EGFP within the aortic arches (aa3?6aa, arrows) and the mesenchyme of the forming jaw (arrowhead); ey, eye; ea, ear. (B) Whole-mount in situ hybridization of endogenous fli1 transcript showing expression within aortic arches (arrows) and jaw primordium (arrowhead, out of focal plane). (C) Live 7-dpf larva showing EGFP expression in structures such as the parachordal cartilage (pc) as well as the vessels within the gills arches (aa5 and aa6; white arrow). EGFP expression is also apparent in the mesenchyme of the developing fin bud (f). (D) Ventral view of embryo in (C); EGFP expression in cells of the forming the jaw, such as Meckel?s cartilage (m) and the palatoquadrate (pq), and associated vessels, such as the hypobranchial artery (ha) as well as the ventricle (v) and atrium (a) of the heart. Scale bar, 100 μm. |
|
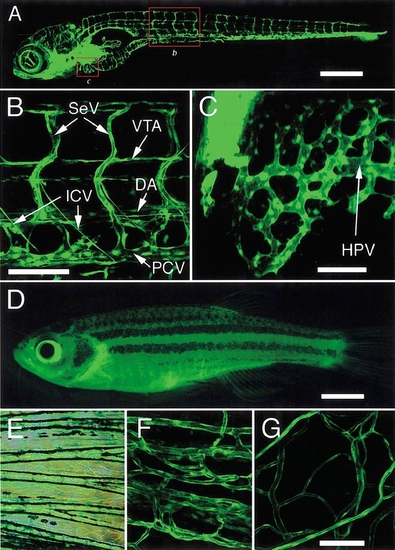
EGFP expression in the vasculature of live TG(fli1:EGFP)y1; albb4 larvae and adults. (A?G) Lateral views, anterior to the left, dorsal is up. (B, C, F, G) Images acquired using multiphoton laser scanning microscopy. (A) A 7-dpf larva, compiled from five separate image reconstructions. Boxed areas labeled ?b? and ?c? indicate regions shown in (B) and (C), respectively; images in (A) and (B) are from two different larvae. (B) Image of trunk vessels at 7 dpf showing patent vessels such as the dorsal aorta (DA), posterior cardinal vein (PCV), segmental vessels (SeV), as well as vessels that do not carry blood flow at this time such as the vertebral arteries (VTA) and intercosta vessels (ICV). (C) Hepatic (liver) vasculature in a 5-dpf larva. The hepatic portal vein (HPV) is noted (arrow). (D) Full-length view of TG(fli1:EGFP)y1 adult fish. (E) Merged transmitted light and fluorescent image from the tail fin of the fish shown in (D). (F) Tail fin microvasculature in adult shown in (D). (G) EGFP-positive blood vessels associated with surface scales in adult shown in (D). Three-dimensional reconstructions of the images in (B), (C), (F), and (G) are available at http://zfish.nichd.nih.gov/zfatlas/fli-gfp/Fli_Home.html. Scale bar, (A) 500 μm; (B) 100 μm; (C) 50 μm; (D) 5 mm; (F, G) 100 μm. |
|
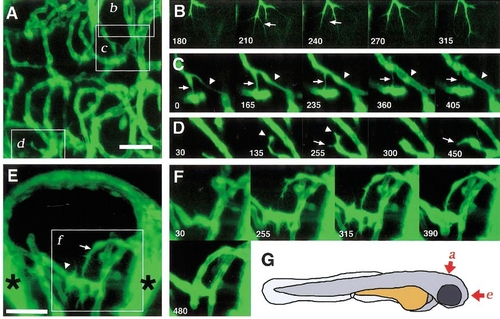
Time-lapse analyses of cranial vessels in TG(fli1:EGFP)y1; albb4/b4 larvae using multiphoton imaging. (A) Central arteries in zebrafish hindbrain at approximately 3.5 dpf, dorsal view, anterior to the right; see (G) for orientation of images. (B?D) Time-lapse sequences of the regions delineated by the corresponding boxes (b, c, d) in (A). (B) A growing central artery exhibiting extension and regression of numerous filopodial extensions (arrows in 210′ and 240′; see Movie 2). (C) A branched central artery exhibits regression of one connection (indicated by an arrow throughout the sequence), while the other connection is retained and appears lumenized by the end of the sequence (arrowhead; see Movie 3). (D) A central artery sprout (arrowhead in time points 135′ and 255′) contacts a potential target vessel via its numerous filopodia. It then regresses and sprouts in a different direction (arrow, time points 255′ and 450′; see Movie 4). (E) Zebrafish forebrain at approximately 2.5 dpf showing communicating vessel (arrow) and palatocerebral artery (arrowhead), frontal view, dorsal up; see (G) for orientation. Brightly labeled plexuses of vessels behind the eye are noted (asterisks). Boxes indicate contact with the palatocerebral artery. Both the communicating vessel and palatocerebral artery exhibit filopodial extensions on the surface (for example, see time point 255′). Filopodial activity in both vessels diminishes just prior to lumenization of the communicating vessel (compare time points 315′ and 480′; see Movie 5). Time-lapse movies and selected three-dimensional reconstructions are available at http://zfish.nichd.nih.gov/zfatlas/fli-gfp/Fli_Home.html. Scale bar, (A, E) 50 μm. |
|
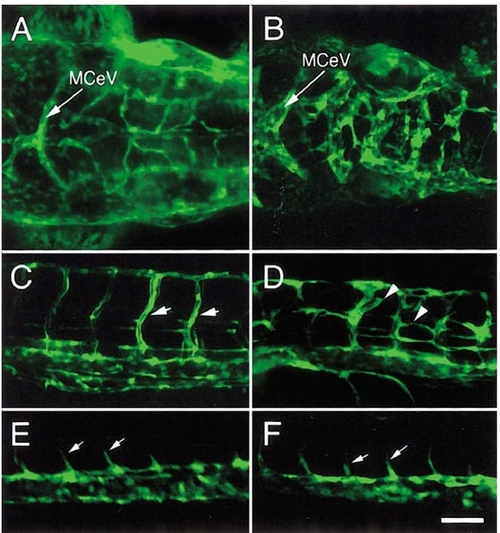
Vascular defects in TG(fli1:EGFP)y1; mibta52b embryos. (A) Head of a wild type TG(fli1:EGFP)y1 embryo at 2 dpf. Arrow indicates midcerebral vein which runs along the midbrain?hindrain boundary. (B) Head vasculature within the hindbrain (posterior to the midcerebral vein) of a TG(fli1:EGFP)y1; mibta52b mutant embryo is severely disorganized and highly dilated. The location and pattern of the midcerebral vein appears normal, although it appears dilated. (A, B) Dorsal views, anterior is to the left. (C) Segmental vessels (arrows) appear at regular intervals corresponding to the vertical myosepta of the somites in a wild type TG(fli1:EGFP)y1 embryo. (D) In TG(fli1:EGFP)y1 embryos mutant for mibta52b, ectopic segmental vessel sprouts (arrowheads) are seen throughout the trunk. (E) A wild type sibling TG(fli1:EGFP)y1 at the 20-somite stage with segmental vessels (arrows) sprouting from the dorsal aorta. (F) Segmental vessel sprouts appear normal inTG(fli1:EGFP)y1; mibta52b mutant embryos at the 20-somite stage. (C?F) Lateral views, anterior is to the left, dorsal is up. Scale bar, (C?F) 50 μm. |
Reprinted from Developmental Biology, 248(2), Lawson, N.D. and Weinstein, B.M., In vivo imaging of embryonic vascular development using transgenic zebrafish, 307-318, Copyright (2002) with permission from Elsevier. Full text @ Dev. Biol.

