
Fig. 3
- ID
- ZDB-FIG-080326-8
- Publication
- Pézeron et al., 2008 - Live analysis of endodermal layer formation identifies random walk as a novel gastrulation movement
- Other Figures
- All Figure Page
- Back to All Figure Page
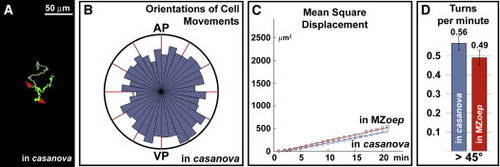
Random Walk Does Not Depend on Cell Interactions One or a few Nodal-activated cells were transplanted into endoderm-deficient casanova morphant embryos and into endoderm- and dorsal mesoderm-deficient MZoep mutant embryos. (A) Representative example of 50 min tracks (with 1 min intervals) of two cells derived from one cell transplanted into a casanova morphant embryo. (B) Rose diagram of the directions of cell movements shows that in casanova morphant, transplanted cells migrate in all directions (n = 11 cells from three embryos). (C) Plot (dot) and curve fit (line) of the MSD showing that these cells move in a random walk during early gastrulation (in casanova: linear fit, R = 0.992, n = 11 cells from three embryos; in MZoep: linear fit, R = 0.997, n = 14 cell from four embryos). (D) The graph illustrates the average number of turns per minute per Nodal-activated cell. Even in the absence of other endodermal cells (in casanova) or of hypoblastic cells (in MZoep), Nodal-activated cells frequently change their direction. Error bars represent standard errors. |