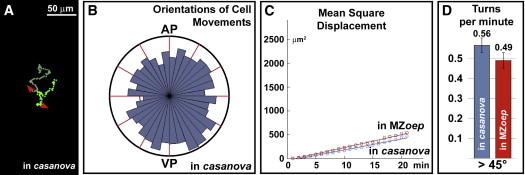
Fig. 3 Random Walk Does Not Depend on Cell Interactions One or a few Nodal-activated cells were transplanted into endoderm-deficient casanova morphant embryos and into endoderm- and dorsal mesoderm-deficient MZoep mutant embryos. (A) Representative example of 50 min tracks (with 1 min intervals) of two cells derived from one cell transplanted into a casanova morphant embryo. (B) Rose diagram of the directions of cell movements shows that in casanova morphant, transplanted cells migrate in all directions (n = 11 cells from three embryos). (C) Plot (dot) and curve fit (line) of the MSD showing that these cells move in a random walk during early gastrulation (in casanova: linear fit, R = 0.992, n = 11 cells from three embryos; in MZoep: linear fit, R = 0.997, n = 14 cell from four embryos). (D) The graph illustrates the average number of turns per minute per Nodal-activated cell. Even in the absence of other endodermal cells (in casanova) or of hypoblastic cells (in MZoep), Nodal-activated cells frequently change their direction. Error bars represent standard errors.
Image
Figure Caption
Acknowledgments
This image is the copyrighted work of the attributed author or publisher, and
ZFIN has permission only to display this image to its users.
Additional permissions should be obtained from the applicable author or publisher of the image.
Full text @ Curr. Biol.

