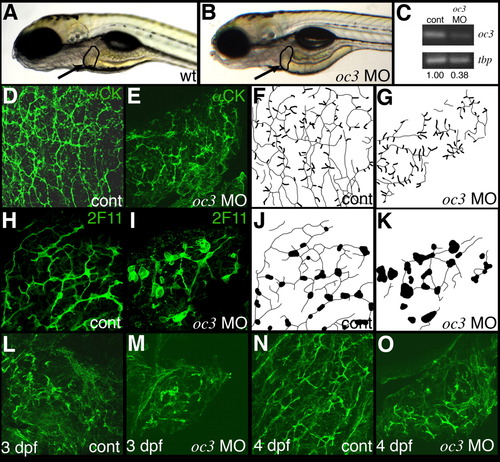
Antisense morpholino-mediated knockdown of oc3 perturbs bile duct development. A,B: Left lateral view of live 5-dpf (A) control and (B) onecut3 morpholino-injected larvae. Note the similarity in liver size and morphology of these larvae (black outline and arrow). C: Semiquantitative PCR of oc3 and tbp (TATA-box binding protein gene) using RNA from control 24-hpf larvae (cont) and from 24-hpf larvae injected with the splice-blocking oc3 morpholino, IE2 MO. Morpholino knockdown significantly reduces oc3 expression. D-G, L-O: Confocal projections of cytokeratin immunostained 5-dpf (D, E), 3-dpf (L, M), or 4-dpf (N, O) whole-mount livers injected with vehicle control (D, L, N), or oc3 morpholino antisense oligonucleotide (E, M, O). The similarity of all 3 oc3 morpholino-injected bile duct staining patterns suggests that the progression of biliary development was inhibited by the knockdown. Non-biliary cytokeratin staining in oc3 morphant livers is similar to the keratin staining seen in 3-dpf wild-type larvae (L). F, G: Schematic representations of the confocal projections in D and E. Ducts are depicted as thin lines while terminal ductules are depicted with a larger caliber in this schematic. These schematics do not account for depth of the confocal projection; thus, all ducts are rendered with equal intensity. Confocal projections of 2F11 immunostained 5-dpf whole-mount livers from control (H) and Oc3 morpholino-injected (I) larvae. There are fewer ducts and biliary cell morphology is abnormal in this morpholino-injected larva. J, K: Schematic representation of the confocal projections in H and I. Ducts are depicted as thin lines while cell bodies are the larger black structures. As with F and G, the schematics do not account for the depth of the confocal projection. Comparable ductal defects and cell morphology defects were observed in 3 other morpholino-injected larvae analyzed (not shown).
|
