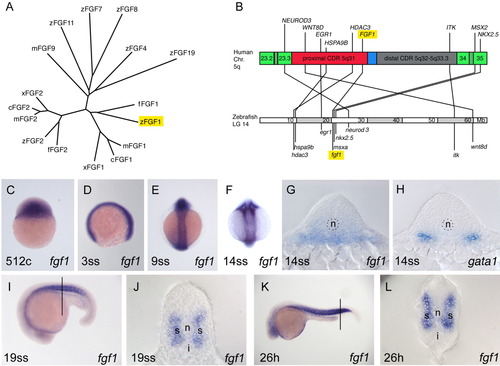
Genomic position and expression of zebrafish fgf1. A: Tree showing the similarity of selected fibroblast growth factor (FGF) family members. The tree is based on the alignment of deduced amino acids. Only the conserved core region of FGFs has been aligned to allow a comparison to distant family members as well. c, chick; f, Fugu; m, mouse; x, Xenopus; z, zebrafish. B: Comparison of the genomic position of zebrafish fgf1 on linkage group 14 (chromosome 14) and human FGF1 on chromosome 5q. Critically deleted regions (CDRs) are indicated in 5q. Selected genes syntenic in both species are shown for the CDR and flanking regions. C-L: Expression of fgf1 and gata1 (H) during zebrafish embryogenesis. Stages are indicated bottom left. C-F,I,K: Whole-mount in situ hybridization. G,H,J,L: Sections of stained embryos. C,D,I,K: Lateral views. E,F: Dorsal views. G: A section through the posterior trunk region of an embryo as in F. H: A corresponding section of an embryo stained for gata1 as a marker for hematopoietic tissue. The position of sections in J and L are indicated by black lines in I and K, respectively. i, ICM; n, notochord; s, somite
|
