
FIGURE
Fig. 2
Fig. 2
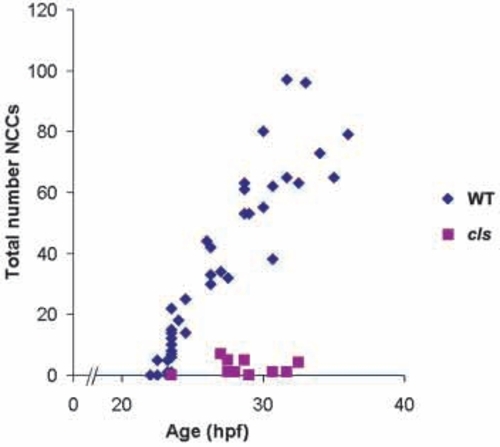
Lateral migration path neural crest cells are severely reduced in cls-/- embryos from the earliest stages. Neural crest cell counts of each embryo are plotted as a single symbol (wild-type = blue, n=39; cls- = pink, n
|
Expression Data
Expression Detail
Antibody Labeling
Phenotype Data
| Fish: | |
|---|---|
| Observed In: | |
| Stage: | Prim-15 |
Phenotype Detail
Acknowledgments
This image is the copyrighted work of the attributed author or publisher, and
ZFIN has permission only to display this image to its users.
Additional permissions should be obtained from the applicable author or publisher of the image.
Full text @ Development