Fig. 3
- ID
- ZDB-FIG-051219-9
- Publication
- Ellingsen et al., 2005 - Large-scale enhancer detection in the zebrafish genome
- Other Figures
- All Figure Page
- Back to All Figure Page
|
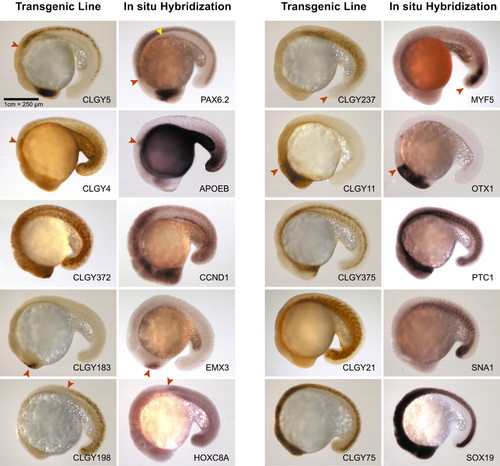
Comparison of YFP expression in transgenic lines with RNA expression patterns of candidate genes. Embryos are 18 hours post fertilization, anterior towards the left and dorsal upwards. CLGY5/pax6.2 are expressed in the same domains, retina, pineal and spinal cord, with exception of the pancreas seen in the in situ stain (yellow arrowhead) and much weaker expression in hindbrain in the transgenic line (anterior limit of expression domain is marked with a red arrowhead). CLGY4/apoeb are highly similar in expression, including the pectoral fin buds (arrowhead). CLGY372/ccnd1 are very similar with a widespread and highly dynamic expression. CLGY183/emx3 are expressed in the telencephalon only (arrowhead). CLGY198/hoxc8a share the same anterior boundary (arrowhead). Expression in CLGY237/myf5 is similar in the developing muscle, but the tail bud expression (arrowhead) of the endogenous RNA is not seen in the transgenic line. CLGY11/otx1l have a highly similar expression pattern, anterior boundary shown by an arrowhead. CLGY375/ptc1 are very similar. CLGY21/snai1a are expressed in the same domain, skeletal muscle. CLGY75/sox19 are both expressed at high levels throughout the CNS. |

