
FIGURE
Fig. 4
- ID
- ZDB-FIG-050316-8
- Publication
- Wingert et al., 2004 - The chianti zebrafish mutant provides a model for erythroid-specific disruption of transferrin receptor 1
- Other Figures
- All Figure Page
- Back to All Figure Page
Fig. 4
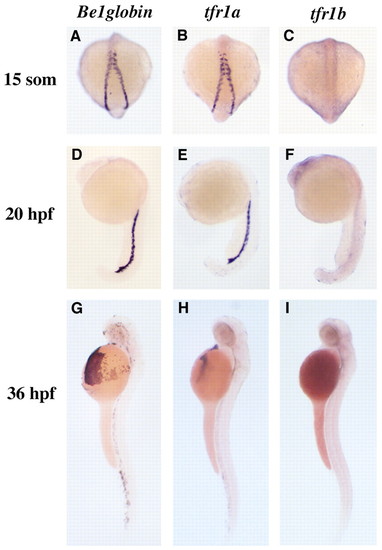
Expression patterns of zebrafish tfr1a and tfr1b during embryogenesis. Whole-mount RNA in-situ hybridization for tfr1a (B,E,H) shows an expression pattern restricted to the hematopoietic intermediate cell mass and later circulating blood, identical to that of �e1 globin (A,D,G), shown at 15 somites, 20 hpf, and 36 hpf. By contrast, the expression of tfr1b (C,F,I) at these timepoints is ubiquitous. |
Expression Data
| Genes: | |
|---|---|
| Fish: | |
| Anatomical Terms: | |
| Stage Range: | 14-19 somites to Prim-25 |
Expression Detail
Antibody Labeling
Phenotype Data
Phenotype Detail
Acknowledgments
This image is the copyrighted work of the attributed author or publisher, and
ZFIN has permission only to display this image to its users.
Additional permissions should be obtained from the applicable author or publisher of the image.
Full text @ Development