
Fig. 7
- ID
- ZDB-FIG-231215-76
- Publication
- Thompson et al., 2020 - Identification and requirements of enhancers that direct gene expression during zebrafish fin regeneration
- Other Figures
- All Figure Page
- Back to All Figure Page
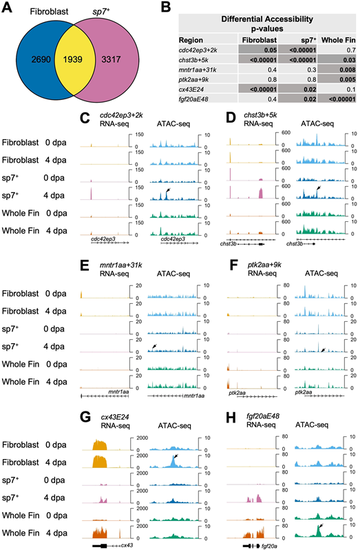
Regenerating fibroblast and osteoblast populations show distinct chromatin accessibility patterns. (A) Venn diagram of comparative analysis indicating overlap in differentially expressed transcripts in purified fibroblasts and sp7+ osteoblasts. (B) Table of P-values for differential accessibility changes in TREEs from this study and that by Lee et al. (2020), representing sp7+ osteoblasts, fibroblasts and whole-fin datasets. Differentially accessible peaks at P<0.05 are noted with darker cells. (C-F) RNA-seq and ATAC-seq browser tracks in sp7+ osteoblasts, fibroblasts and whole-fin datasets indicating TREEs reported by Lee et al. (2020) in sp7+ osteoblasts. Osteoblast TREEs cdc42ep3+2k and chst3b+5k exhibit a significant decrease in accessibility in regenerating fibroblast tissue (C,D), whereas sp7− TREEs mntr1aa+31k and ptk2aa+9k exhibit increased accessibility in regenerating whole-fin tissue at 4 dpa (E,F). Tracks represent normalized combined replicates. (G,H) RNA-seq and ATAC-seq browser tracks in sp7+ osteoblasts, fibroblasts and whole-fin datasets indicating TREEs presented in this study. Both the mesenchymal TREE cx43E24 (G) and epidermal TREE fgf20aE48 (H) exhibit increased accessibility in sp7+ osteoblasts at 4 dpa compared with 0 dpa. |