
|
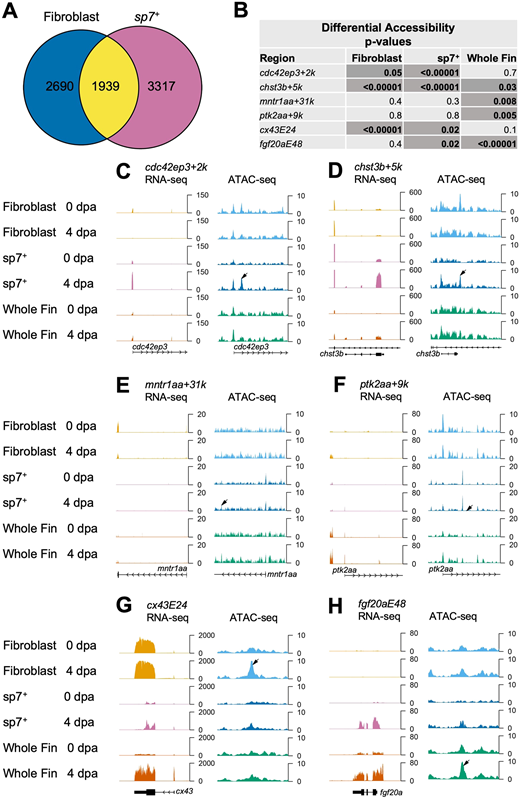
Fig. 7 Regenerating fibroblast and osteoblast populations show distinct chromatin accessibility patterns. (A) Venn diagram of comparative analysis indicating overlap in differentially expressed transcripts in purified fibroblasts and sp7+ osteoblasts. (B) Table of P-values for differential accessibility changes in TREEs from this study and that by Lee et al. (2020), representing sp7+ osteoblasts, fibroblasts and whole-fin datasets. Differentially accessible peaks at P<0.05 are noted with darker cells. (C-F) RNA-seq and ATAC-seq browser tracks in sp7+ osteoblasts, fibroblasts and whole-fin datasets indicating TREEs reported by Lee et al. (2020) in sp7+ osteoblasts. Osteoblast TREEs cdc42ep3+2k and chst3b+5k exhibit a significant decrease in accessibility in regenerating fibroblast tissue (C,D), whereas sp7− TREEs mntr1aa+31k and ptk2aa+9k exhibit increased accessibility in regenerating whole-fin tissue at 4 dpa (E,F). Tracks represent normalized combined replicates. (G,H) RNA-seq and ATAC-seq browser tracks in sp7+ osteoblasts, fibroblasts and whole-fin datasets indicating TREEs presented in this study. Both the mesenchymal TREE cx43E24 (G) and epidermal TREE fgf20aE48 (H) exhibit increased accessibility in sp7+ osteoblasts at 4 dpa compared with 0 dpa.