
Fig. 1
- ID
- ZDB-FIG-231215-73
- Publication
- Thompson et al., 2020 - Identification and requirements of enhancers that direct gene expression during zebrafish fin regeneration
- Other Figures
- All Figure Page
- Back to All Figure Page
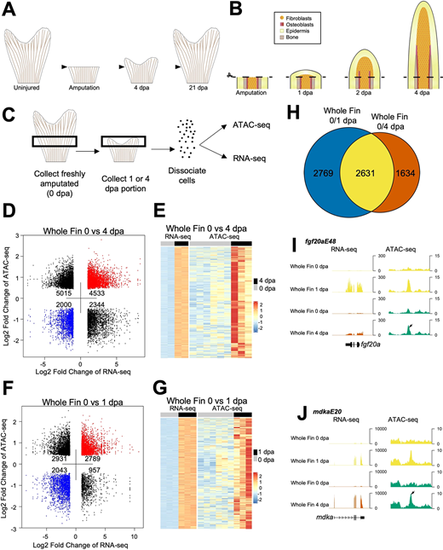
Chromatin accessibility profiling of regenerating zebrafish fins. (A) By 4 dpa, the fin regeneration blastema is formed, and proliferating fibroblasts and osteoblasts actively restore lost mesenchymal tissue, extracellular matrix and bone. Zebrafish are able to fully regenerate their fins by 2-3 weeks after injury. (B) Immediately following fin ray amputation, epidermal cells migrate to cover the site of injury and signal to the underlying mesenchyme, which forms a regeneration blastema. The blastema is formed by 2 dpa, and osteoblasts align at the basal epidermal layer and begin to deposit matrix by 3-4 dpa. (C) Overview of sample collection and enzymatic dissociation for ATAC-seq and RNA-seq profiling of 0 dpa, 1 dpa and 4 dpa fin tissue. Uninjured samples were collected from ∼1.5 mm portions of tissue from the middle region of fins, while regenerating samples were collected at 1 or 4 dpa from the regenerating tissue and one joint proximal to the amputation plane. Each sample contained 15 pooled fin clips. (D) Dot plot of differential ATAC-seq chromatin regions linked to nearby differential transcripts in 4 dpa versus 0 dpa whole-fin samples. Each point indicates a separate ATAC-seq peak. (E) Heat map of increased transcripts in 4 dpa versus 0 dpa regenerating whole-fin tissue linked to nearby differentially accessible chromatin regions. Uninjured 0 dpa samples for both 4 dpa and 1 dpa datasets were used to consider batch effects when performing differential comparison. (F) Dot plot of differential ATAC-seq chromatin regions linked to nearby differential transcripts in 1 dpa versus 0 dpa whole-fin samples. Each point indicates a separate ATAC-seq peak. (G) Heat map of upregulated transcripts in 1 dpa versus 0 dpa regenerating whole-fin tissue linked to nearby differentially accessible chromatin regions. Uninjured 0 dpa samples for both 4 dpa and 1 dpa datasets were used to consider batch effects when performing differential comparison. (H) Venn diagram comparison of differentially expressed genes in 0 versus 1 dpa compared with 0 versus 4 dpa RNA-seq data. Many of the transcripts that are differential at 4 dpa from 0 dpa are also differential at 1 dpa. (I,J) Browser tracks of TREEs near fgf20a, fgf20aE48 (I) and mdka, mdkaE20 (J). Both genes increase transcript levels during regeneration. Tracks represent normalized combined replicates. |