
- Title
-
Mapping the cellular expression patterns of vascular endothelial growth factor aa and bb genes and their receptors in the adult zebrafish brain during constitutive and regenerative neurogenesis
- Authors
- Fernezelian, D., Pfitsch, S., Rastegar, S., Diotel, N.
- Source
- Full text @ Neural Dev.

Expression of vegfaa and vegfbb genes in the adult zebrafish brain. In situ hybridization was performed on transverse sections through various brain regions, including the telencephalon (A1 and B1), the anterior (A2 and B2) and posterior parts (A3 and B3) of the preoptic area, and the anterior (A4 and B4), mediobasal (A5 and B5), and caudal (A6 and B6) hypothalamus. Both vegfaa and vegfbb transcripts were detected in the different brain subdivisions including the telencephalon, diencephalon and mesencephalon in the parenchyma and along the ventricular/periventricular layers. A1' to B6' correspond to higher magnification images taken at the level of the square and show gene expression in the ventricular and periventricular layers of the dorsomedian telencephalon (Dm), anterior (PPa) and posterior parts (PPp) of the preoptic area, the anterior part of the hypothalamus (Hv), the periventricular pretectal nucleus (PPp) and the subgranular grey zone of the optic tectum (TeO). Bars: 200 ?m (A1 to B3), 300 ?m (A4 to B6) and 50 ?m (A1? to B6?) |
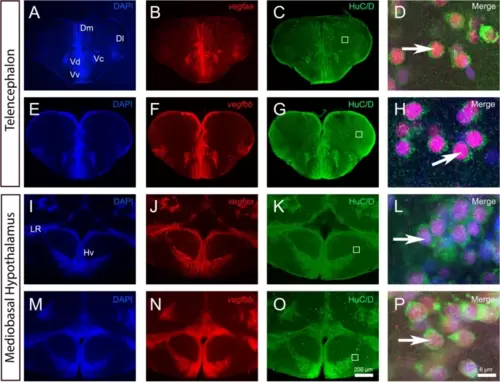
vegfaa and vegfbb are expressed in almost all neurons within telencephalon and mediobasal hypothalamus. A-P vegfaa and vegfbb in situ hybridization (red) followed by HuC/D immunohistochemistry (green) in the telencephalon (A-H) and mediobasal hypothalamus (I-P) with DAPI counterstaining (blue). D, H, L and P High magnification views of the dorsomedian telencephalon (Dm) (D and H) and of the mediobasal hypothalamus (Hv) (L and P) showing that vegfaa and vegfbb are strongly expressed in HuC/D-positive neurons (see arrows). White squares (C, G, K and O) highlight the respective high-power magnifications in D, H, L and P. Arrows show examples of co-expression of vegfaa and bb with HuC/D. Bars: 200 �m (A-C, E?G, I-K, M?O) and 6 �m (D, H, L and P) |
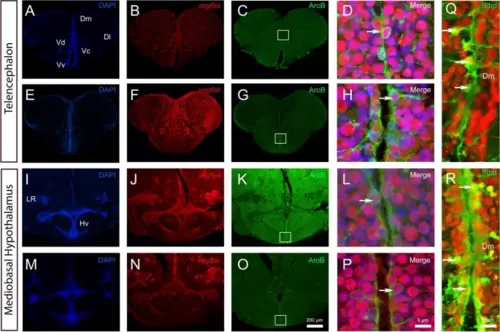
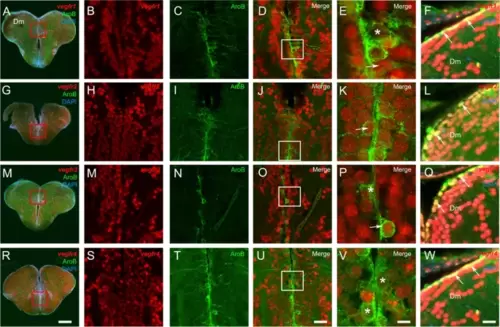
vegfaa and vegfbb are expressed in almost all neural stem cells. A-P vegfaa and vegfbb in situ hybridization (red) followed by AroB immunohistochemistry (green) in the telencephalon (A-H) and mediobasal hypothalamus (I-P) with DAPI counterstaining (blue). High magnification views of the dorsomedian telencephalon (Dm) (D and H) and of the mediobasal hypothalamus (Hv) (L and P) showing that vegfaa and vegfbb (in red) are detected in some AroB-positive neural stem cells (see arrows). White squares (C, G, K and O) highlight the respective high-power magnifications in D, H, L and P. Q and R vegfaa and vegfbb in situ hybridization (red) followed by Blbp immunohistochemistry (green) in the dorsomedian telencephalon. Arrows show examples of co-expression of vegfaa and bb with AroB and Blbp. Bars: 200 �m (A-C, E?G, I-K, M?O), 10 �m (Q and R) and 6 �m (D, H, L and P) |
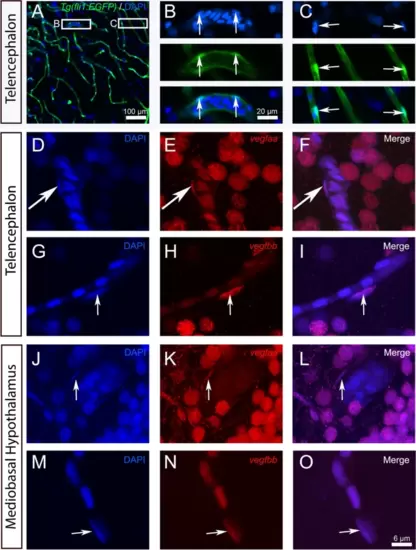
vegfaa and vegfbb are expressed in endothelial cells. A-C Representative image of Tg(fli1a:EGFP) zebrafish brain section through the telencephalon with DAPI counterstaining. B and C show high-power views of the white squares in A, with split channels showing DAPI in blue, the fli1a:EGFP transgene in green, and the merged images. Arrows indicate that elongated nuclei lining the blood vessels correspond to fli1a:EGFP-positive endothelial cells. (D-O) vegfaa and vegfbb in situ hybridization (red) with DAPI staining in the telencephalon (D-I) and mediobasal hypothalamus (J-O). vegfaa and vegfbb (in red) are expressed in some elongated nuclei localized along blood vessels and corresponding to endothelial cells (see arrows). Bar: 100 �m (A), 20 �m (B-C).6 �m (D-O) |
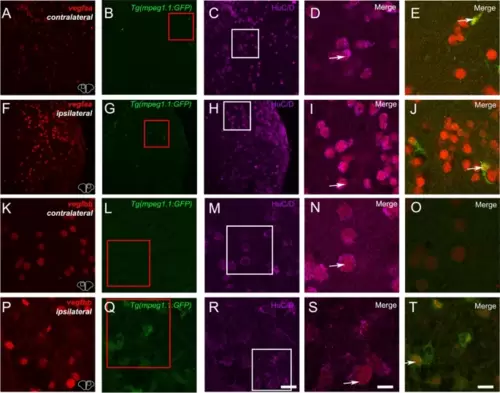
vegfaa and vegfbb are up-regulated after brain lesion notably in neurons and microglia. Fluorescent ISH (red) followed by HuC/D immunostaining (purple) on Tg(mpeg1.1:GFP) (green) showing vegfaa and vegfbb at 1 day post-lesion in contralateral and ipsilateral telencephalic hemispheres. (D, I and E, J) High magnification views at the levels of the white and red squares showing vegfaa expression in neurons (D and I) and in microglia (E and J). (N, S and O, T) High magnification views at the levels of the white and red squares showing vegfbb expression in neurons (N and S) and in microglia/immune cells (O and T). Bar: 50 �m (A-C and F?H), 14 �m (D-E, I-J, K-M and P-R), 7 �m (N?O and S-T) |
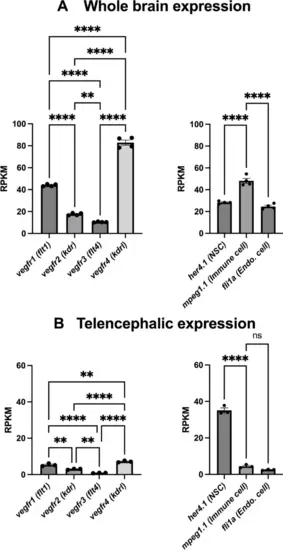
Gene expression levels of the different vegf receptors in the whole brain and the telencephalon. Extraction of RNA sequencing data sets from [27, 61, 78] showing relative expression levels of genes for different vegf receptors in the whole brain (A) or telencephalon (B). Note that specific neural stem cell (her4.1), microglia/immune cell (mpeg1.1), and endothelial gene (fli1a) markers were provided for comparison of gene expression levels. These data show that vegfr are expressed at significant levels in a manner similar to most of the reference markers |
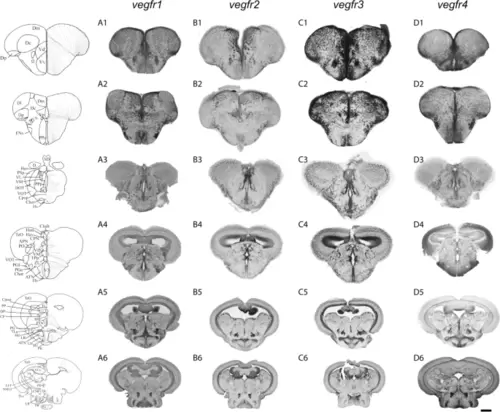
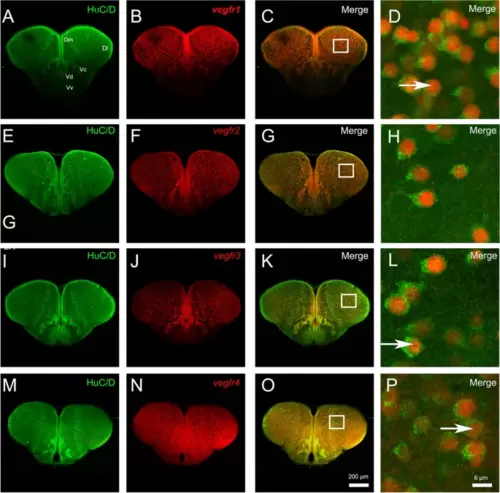
Overview of vegfr1, vegfr2, vegfr3, and vegfr4 expression in the adult zebrafish brain. vegfr1, vegfr2, vegfr3, and vegfr4 in situ hybridization on transverse sections through the telencephalon (A1, B1, C1 and D1), the anterior (A2, B2, C2 and D2), and posterior part (A3, B3, C3 and D3) of the preoptic area, and the anterior (A4, B4, C4 and D4), the mediobasal (A5, B5, C5 and D5), and the caudal (A6, B6, C6 and D6), hypothalamus. The expression of the different vegfr genes is widely detected throughout the whole brain, in the parenchyma and along the periventricular/ventricular layers corresponding to neurogenic regions. Expression is somehow ubiquitous. Bars: 200 ?m (A1 to D3); 300 ?m (A4 to D6) |
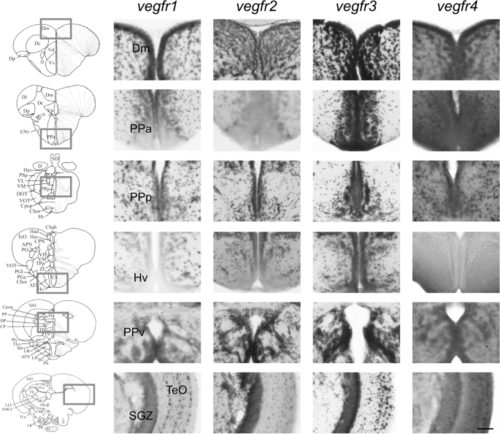
vegfr1, vegfr2, vegfr3, and vegfr4 expression in the adult zebrafish brain. In situ hybridization for vegfr1, vegfr2, vegfr3, and vegfr4 performed on transverse sections through the dorsomedian telencephalon (Dm), the anterior (PPa) and posterior part (PPp) of the preoptic area, the anterior hypothalamus (Hv), the periventricular pretectal nucleus (PP) and the optic tectum (TeO), with a focus on the subgranular grey zone (SGZ). Expression of vegfr genes is detected widely throughout the brain, in both the parenchyma and along the periventricular/ventricular layers which are associated with neurogenic regions. The expression is relatively ubiquitous. Bars: 100 ?m |
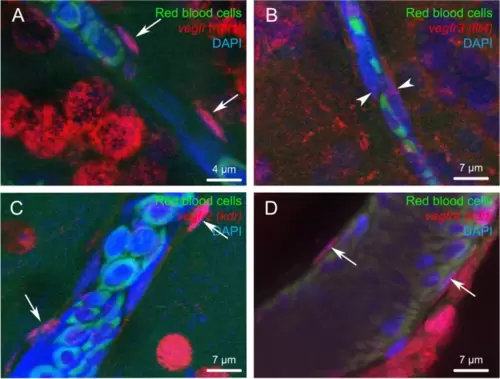
Vegf receptor gene expression in endothelial cells. Fluorescent in situ hybridization of vegfr (red) showing expression in endothelial cells for vegfr1, 2 and 4. Note that endothelial cells correspond to cells with an elongated nucleus (arrows) localized along the blood vessels. Arrowheads show a very weak vegfr3 labeling in endothelial cells. The red blood cells exhibit green autofluorescence. DAPI counterstaining allows to visualize cell nuclei (blue). Bars: 4 ?m (A), 7 ?m (B, C and D) |
vegf receptor expression is observed in most neurons within the telencephalon. A-P vegfr1, vegfr2, vegfr3, and vegfr4 in situ hybridization (red) followed by HuC/D immunohistochemistry (green) in the telencephalon. D, H, L and P High magnification views of the respective white squares in the telencephalon showing that most vegfr-positive cells correspond to HuC/D-positive neurons. Bars: 200 �m (A-C, E?G, I-K, M?O) and 6 �m (D, H, L and P) |
vegfr genes are expressed in neural stem cells. A-R vegfr1, vegfr2, vegfr3, and vegfr4 in situ hybridization (red) followed by AroB immunohistochemistry (green) in the telencephalon with DAPI counterstaining (blue). B, H, M, and S High magnification views of the ventricular layer at the levels of the red squares in the telencephalon showing vegfr gene expression along the ventricular layer. C, I, N and T High magnification views of the respective red squares showing AroB-positive cells. D, J, O and U Merged pictures showing the colocalization between the vegfr and the AroB-positive cells. The asterisks (*) and arrows (last columns) represent the absence or presence of vegfr expression in neural stem cells, respectively. F, L, Q and W vegfr1, vegfr2, vegfr3, and vegfr4 in situ hybridization (red) followed by Blbp immunohistochemistry (green) in the dorsomedian telencephalon (Dm) with DAPI counterstaining (blue) showing that almost all Blbp-positive neural stem cells are vegfr-positive (see arrows). Bar: 200 �m (A, G, M, and R), 30 �m (B-D, H-J, M?O and S-U), 15 �m (F, L, Q, and W), 7 �m (E, K, P, and V) |
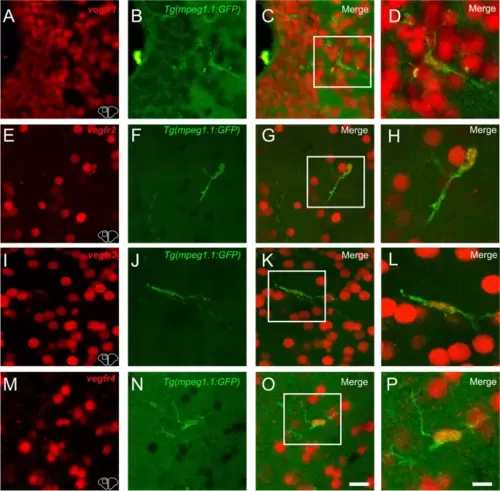
vegfr1, vegfr2, vegfr3, and vegfr4 expression in microglia/immune cells. A-C, E?G, I-K, and M?O vegfr1, vegfr2, vegfr3, and vegfr4 in situ hybridization (red) in Tg(mpeg1.1:GFP) zebrafish (green) at the level of the telencephalon. C, G, K and O Merged images showing colocalization between vegfr and microglial cells. Although expression is mostly present in other cell types, a colocalization is found between vegfr and microglia/immune cells. D, H, L and P Higher magnification view of the square in the preceded picture further presenting the vegfr expression in microglia/immune cells. Bar: 6 �m (D, H, L and P) |
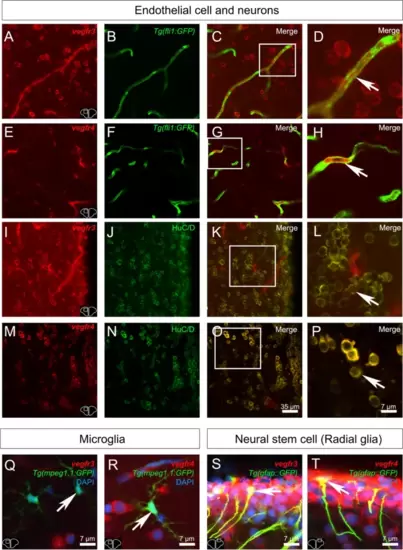
Vegfr3 and Vegfr4 are expressed in neurons, endothelial cells and neural stem cells. A-T Vegfr3 and Vegfr4 immunostainings (red) in adult zebrafish telencephalon. A-D and E?H Vegfr3 (A-D) and Vegfr4 (E?H) expression (red) in endothelial cells (green) from Tg(fli1a:EGFP) zebrafish (see arrows). I-L and M-P Vegfr3 (I-L) and Vegfr4 (M-P) expression (red) in HuC/D -positive cells (neurons) cells in adult zebrafish (see arrows). D, H, L and P High magnifications views of the respective white square. Q, R Merged images showing no colocalization between Vegfr3 (Q) and Vegfr4 (R) in microglial cells/immune cells (green) from Tg(mpeg1.1:GFP) (see arrows). (S-T) Merged images showing colocalization between Vegfr3 (Q) and Vegfr4 (R) in neural stem cells (green) from Tg(GFAP::GFP) (see arrows). Bars: 35 �m (A-C, E?G, I-K) Bar: 7 �m (D, H, L, P, Q, R, S and T) |
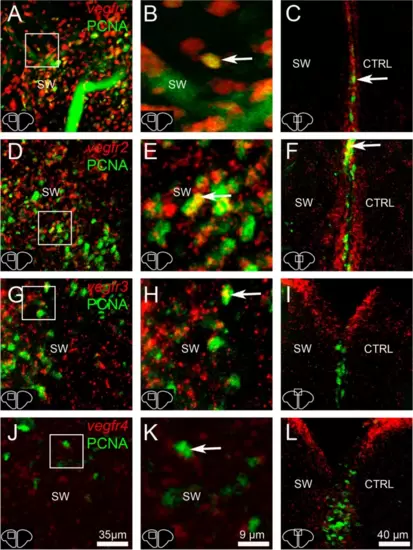
Numerous proliferative cells in the parenchyma are vegfr-positive. A, B, D, E, G, H, J and K vegfr1, vegfr2, vegfr3, and vegfr4 (red) in situ hybridization followed by PCNA immunohistochemistry (green) at 3 dpl in the stabwounded (SW) hemisphere. Arrows show examples of proliferative cells expressing vegfr. C, F, I and L vegfr1, vegfr2, vegfr3, and vegfr4 (red) in situ hybridization followed by PCNA immunohistochemistry (green) at 5 dpl in the ventricular zone containing neural stem cells that actively proliferate following injury at this time. Most of proliferative cells did not express vegfr (or barely), except for some of them (see arrows). Scale bar = 35 �m (A, D, G and J), 9 �m (B, E, H and K), 40 �m (C, F, I and L) |