- Title
-
Parkinson's disease model in zebrafish using intraperitoneal MPTP injection
- Authors
- Omar, N.A., Kumar, J., Teoh, S.L.
- Source
- Full text @ Front. Neurosci.
|
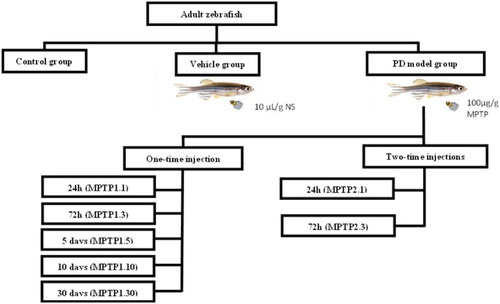
Grouping of experimental animals. Fish were divided into control, vehicle, and MPTP groups. The MPTP1 group received one injection and was further divided based on assessment day, namely 24 h post-injection (MPTP1.1), 72 h post-injection (MPTP1.3), day 5 assessment (MPTP1.5), day 10 assessment (MPTP1.10) and day 30 assessment (MPTP1.30). MPTP2 group received the second dose 24 h after the first dose and was assessed either at 24 h post-second injection (MPTP2.1) or 72 h post-second injection (MPTP2.3). Assessment on all intervals includes a neuro-behavioral assessment from locomotor activity, gene expression, protein level, and histochemical analysis. |
|
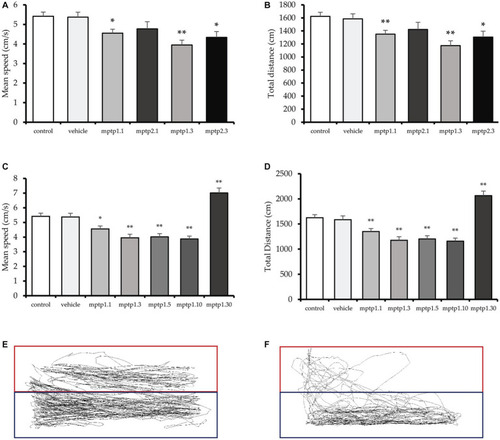
The locomotor assessment of the zebrafish models. PHENOTYPE:
|
|
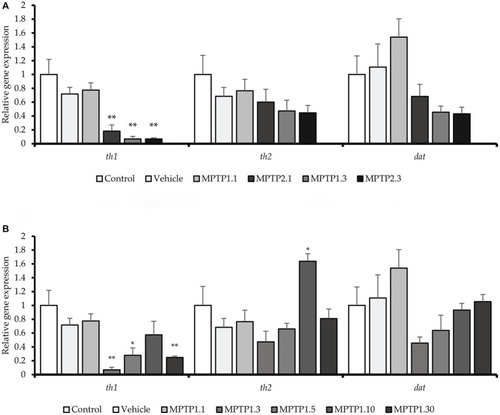
The relative gene expression in the zebrafish model across the group. |
|
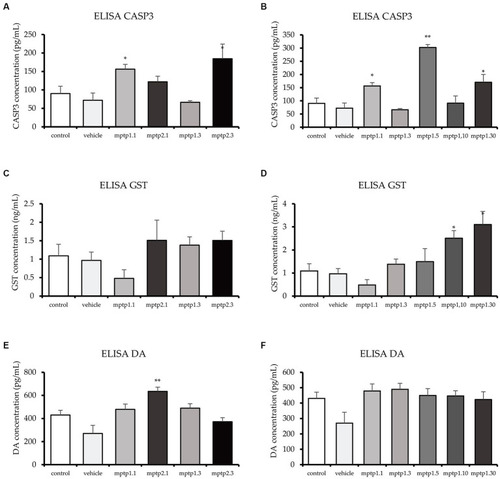
ELISA test for CASP3, GST and DA. CASP3 levels fluctuated across the group, with MPTP1.1 and MPTP1.5 significantly elevated. The GST protein was assessed and showed a sudden drop in MPTP1.1, albeit statistically insignificant. Henceforth, the level significantly increased in the day 10 and day 30 groups. DA levels were equivocal except for MPTP2.1 where it is significantly elevated. |
|
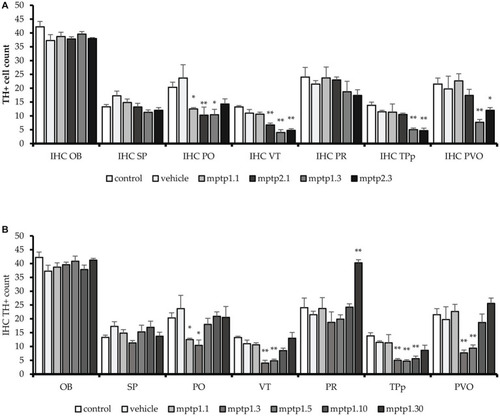
TH+ cells count in different regions of the brain. MPTP in this study has been shown to affect a few areas of dopaminergic neurons, sparing the OB, SP and PR areas. VT and PO area has been seen to be affected the earliest, as early as day 1. Subsequently, other areas were affected. The pattern is similar to other markers tested before, where the lowest counts were noted in MPTP1.3 and MPTP1.5. Day 10 assessment has shown recovery of the cell counts, which mostly return to the same counts as in control on day 10. Although cell counts did not reduce in pretectum following MPTP insult, it is noted that on day 30, the PR cell counts were significantly increased. |
|
Coronal section of ventral thalamus. The TH+ cells were marked by a deep chromogenic stain. The cell number can be seen declining from day one and peaked around days 3 and 5. Day 10 and Day 30 sections showed re-emerging of positive TH+ cell stain. |
|
Coronal section of TPp and PVO. Compared to VT, the drop in TH+ cell counts were more evident starting from day 3, for both one- and two-time MPTP injections. This finding persisted on day 5 of the assessment. Day 10 tissue section showed a slight improvement in TH+ cell count, which progressed eventually during the day 30 assessment. |

