- Title
-
Stx4 is required to regulate cardiomyocyte Ca2+ handling during vertebrate cardiac development
- Authors
- Perl, E., Ravisankar, P., Beerens, M.E., Mulahasanovic, L., Smallwood, K., Sasso, M.B., Wenzel, C., Ryan, T.D., Komár, M., Bove, K.E., MacRae, C.A., Weaver, K.N., Prada, C.E., Waxman, J.S.
- Source
- Full text @ HGG Adv
|
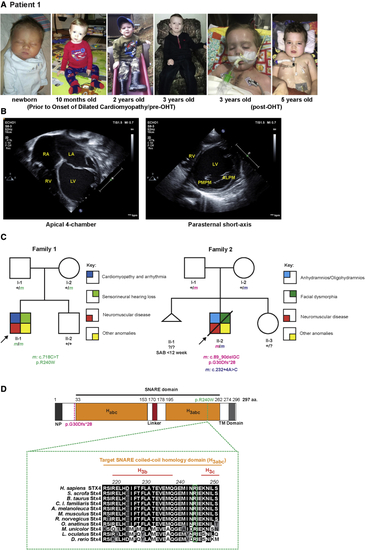
STX4 germline variants in patients (A) Left to right: Photographs of patient 1 taken before and after onset of DCM, and pre- and post-OHT. (B) Echocardiograms at onset of patient?s admission due to heart failure. Left: Apical 4-chamber view at end-diastole showed severely dilated, thin-walled left ventricle and severely dilated left and right atria. Right: parasternal short-axis view at the level of the mitral valve at end-diastole showed severely dilated, thin-walled left ventricle. The patient had severe biventricular systolic dysfunction, and evidence for diastolic dysfunction (biatrial dilation). ALPM, anterolateral papillary muscle; LA, left atrium; LV, left ventricle; PMPM, posteromedial papillary muscle; RA, right atrium; RV, right ventricle. (C) Pedigree segregating the homozygous STX4 c.718C > T; p.R240W variant in family 1 and the c.89_90delGC; p.G30Dfs?28 and c.232+4A > C alleles in family 2. m, variant allele; ?, unknown carrier; SAB, spontaneous abortion without further data. (D) Alignment of portion of the STX4 sequences containing the human variant. There is a high degree of conservation overall for STX4 homologues. For instance, mouse Stx4 and zebrafish stx4 respectively share 95.3% and 75.3% amino acid conservation with human STX4. Dashed-magenta line indicates position of p.G30Dfs?28 allele. Dashed-green line indicates the position of the p.R240W variant and expanded residue sequence indicates the conservation of this residue among the selected vertebrates. The residue positions indicate domain boundaries of the 297 amino acid human STX4 protein.61 Black highlights indicate amino acids that are conserved, gray highlights residues that are chemically similar (conservative), and white highlights display non-conservative variants. Habc, antiparallel three-helix bundle stabilization domain, H3abc, coiled-coil SNARE homology domain; NP, N-terminal peptide, TM, transmembrane. |
|
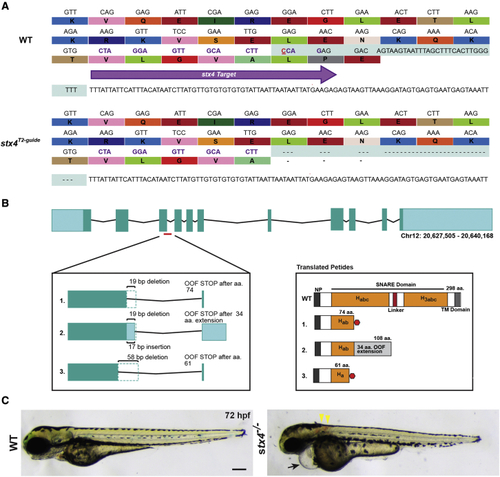
Generation of stx4 mutant zebrafish (A) CRISPR-Cas9 was used to generate a zebrafish stx4 loss-of-function allele that creates a 38-bp deletion (red underlined cytosine marks the endonuclease cut site), eliminating the splice donor site of exon 3 (protospacer denoted by purple arrow and codons; the last three codons at the splice junction are eliminated in stx4 mutants). (B) Schematic of transcripts showing the three alternative splice variants generated from this allele. All three transcripts are predicted to be out-of-frame (OOF; left) and to produce truncation products (translated peptides; right). Habc, antiparallel three-helix bundle stabilization domain; H3abc: coiled-coil SNARE homology domain; NP, N-terminal peptide, TM, transmembrane. Red polygon represents a stop codon in the 298 amino acid sized zebrafish Stx4 protein, resulting in early truncation products. (C) Bright field images of 72 hpf WT/stx4+/? sibling and stx4 mutant larvae. Images of WT sibling embryos in all figures are stx4+/? sibling embryos. Black arrow indicates pericardial edema and linear heart. Yellow arrowheads indicate hemorrhages. stx4 heterozygotes are overtly indistinguishable from WT. Scale bar, 200 ?m. PHENOTYPE:
|
|
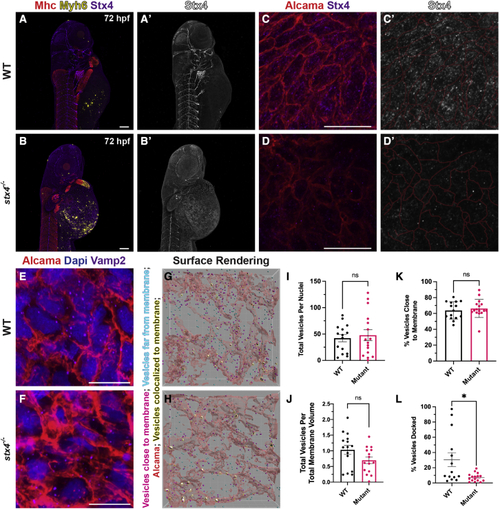
stx4 mutants exhibit loss of Stx4 expression and function (A and B) Confocal images of 72 hpf WT or stx4 mutant larvae labeled using IHC markers for Mhc (striated muscle - red), Myh6 (atrial CMs - yellow) and Stx4 (purple). (A?and B?) Single channel confocal images of Stx4. Scale bars, 100 ?M. (C and D) Confocal images of 72 hpf WT and stx4 mutant CM membranes labeled with Alcama (red), and Stx4 (purple). Scale bars, 10 ?M (C?and D?) Single channel confocal images of Stx4. Membranes (red lines) from (C and D) are indicated. (E and F) Confocal images of 72 hpf WT and stx4 mutant CM membranes labeled with DAPI (nuclei; blue), Alcama (red), and Vamp2 (purple). Scale bars, 10 ?M. (G and H) Imaris surface rendering of max intensity projections of Vamp2 from (E and F). Red surfaces indicate Alcama-labeled sarcolemma; yellow-highlighted white surfaces indicate overlapping vesicle surfaces; magenta spots indicate vesicles identified within the threshold as close to the membrane surface; cyan spots indicate vesicles outside this threshold. (I and J) Total Vamp2+ vesicles from spot rendered puncta normalized to nuclei or cell membrane volume. Vesicles were quantified via spot rendering of puncta labeled with Vamp2. Membrane volumes were obtained from surface renderings of Alcama labeling. Data are represented as the mean ± SEM, n = 15 WT/stx4+/? and n = 16 stx4?/? larvae, Student?s t test. (K) Vamp2+ vesicles quantified near Alcama-labeled membrane surface threshold of 72 hpf WT or stx4 mutant CMs. Data are represented as the mean ± SEM, n = 15 WT/stx4+/? and n = 16 stx4?/? larvae, Student?s t test. (L) Quantification of the percent of colocalized Vamp2+ vesicles over total number of vesicles of 72 hpf WT or stx4 mutant CMs. Vesicle surfaces were colocalized to the CM membrane by masking overlapping surfaces. Data are represented as the mean ± SEM, n = 14 WT/stx4+/? and n = 16 stx4?/? larvae, Student?s t test ?p < 0.05. EXPRESSION / LABELING:
PHENOTYPE:
|
|
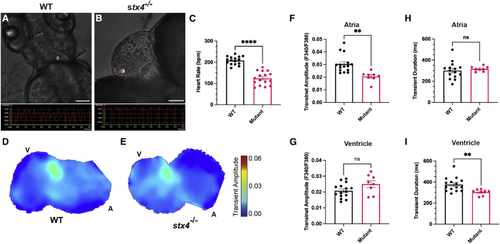
Stx4 regulates Ca2+ handling in CMs (A and B) Screenshots from high-speed images of 72 hpf WT and stx4 mutant larvae showing a ventricular region of interest (ROI) and the resulting kymograph used to quantify heart rates. Scale bars, 100 ?M. (C) Heart rates (HR) determined from ventricular ROIs of 72 hpf WT and stx4 mutant larvae captured by high-speed imaging and quantified as beats per minute (bpm). Mutants exhibit an ?40% reduction in HR versus WT (WT mean HR: 208.4 bpm, Mutant mean HR: 124.3 bpm). Data are represented as the mean ± SEM, n = 16 larvae/group, Student?s t test, ????p < 0.0001. (D and E) Maps of Ca2+ transient amplitudes from paced hearts of 72 hpf WT or stx4 mutant larvae. A, atrium; V, ventricle. The color scale depicts Ca2+ transient amplitudes in fluorescence ratio units (F340/F380). (F and G) Ca2+ transient amplitudes from atrial or ventricular ROIs, respectively. (H and I) Ca2+ transient durations from atrial and ventricular ROIs. Data are represented as the mean ± SEM, n = 14 WT/stx4+/? and n = 8 stx4?/?, Student?s t test, ??p < 0.01. |
|
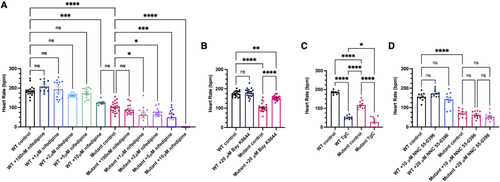
Stx4 regulates L-type voltage gated Ca2+ channel activity (A) Heart rates (HRs) determined from ventricular regions of interest of 72 hpf WT and stx4 mutant larvae following a dose-response treatment with 1% DMSO/embryo water (control), 100 nM nifedipine, 1 ?M nifedipine, 2 ?M nifedipine, 5 ?M nifedipine, or 10 ?M nifedipine for 45 min. Data are represented as the mean ± SEM, n = 10?21 larvae/group, one-way ANOVA, ?p < 0.05, ???p < 0.001, ????p < 0.0001. (B) HRs determined from 72 hpf WT and stx4 mutant larvae treated with either 1% DMSO/embryo water (control) or 20 ?M Bay K-8644. Control stx4 mutants exhibit an ?40% reduction in mean HR versus WT (WT control mean HR: 174.2 bpm, stx4 mutant control mean HR: 104.1 bpm). By contrast, stx4 mutants treated with 20 ?M Bay K-8644 (mean HR: 153.1 bpm) are rescued to ?90% of the WT control HR and ?150% of the untreated stx4 mutant HR, while HR of WTs treated with 20 ?M Bay K-8644 are similar to untreated WT controls (mean HR: 179.3 bpm). Data are represented as the mean ± SEM, n = 20?34 larvae/group, one-way ANOVA, ??p < 0.01, ????p < 0.0001. (C) HRs determined from WT and stx4 mutant larvae treated with either 1% DMSO/embryo water (control) or a mixture of 10 ?M thapsigargin and 10 mM caffeine (TgC). Data are represented as the mean ± SEM, n = 9?10 larvae/group, one-way ANOVA, ?p < 0.05, ????p < 0.0001. (D) HRs determined from a dose-response of WT and stx4 mutant larvae treated with either 1% DMSO/embryo water (control), 10 ?M NNC 55-0396, or 20 ?M NNC 55-0396. Data are represented as the mean ± SEM, n = 10 larvae/group, one-way ANOVA, ????p < 0.0001. PHENOTYPE:
|
|
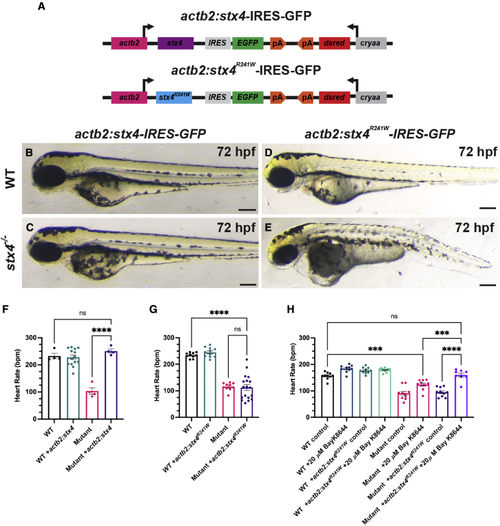
The zebrafish Stx4R241W variant is hypomorphic (A) Schematic of constructs used to generate transgenic zebrafish expressing WT Stx4 (actb2:stx4-IRES-GFP) and the zebrafish Stx4R241W variant (actb2:stx4R241W-IRES-GFP), which is equivalent to the patient 1 STX4R240W variant. (B?E) Images of 72 hpf WT and stx4 mutants hemizygous for the actb2:stx4-IRES-GFP and actb2:stx4R241W-IRES-GFP transgenes. Scale bar, 200 ?M. (F and G) Heart rates determined from ventricular regions of interest of 72 hpf WT and stx4 mutant larvae lacking and hemizygous for actb2:stx4-IRES-GFP or actb2:stx4R241W-IRES-GFP. Data are represented as the mean ± SEM, n = (F) 4?14 and (G) 10?18 larvae/group, respectively, one-way ANOVA, ????p < 0.0001. (H) Heart rates from ventricular ROIs determined from 72 hpf WT and stx4 mutant larvae lacking and hemizygous for actb2:stx4R241W-IRES-GFP treated with either 1% DMSO/embryo water (control) or 20 ?M Bay K-8644. Data are represented as the mean ± SEM, n = 8?10 larvae/group, one-way ANOVA, ???p < 0.001, ????p < 0.0001. PHENOTYPE:
|

