FIGURE SUMMARY
Title

Analysis of incidental findings in Qatar genome participants reveals novel functional variants in LMNA and DSP

Authors
Elfatih, A., Da'as, S.I., Abdelrahman, D., Mbarek, H., Mohammed, I., Hasan, W., Fakhro, K.A., Estivill, X., Mifsud, B., Qatar Genome Program Research Consortium
Source
Full text @ Hum. Mol. Genet.

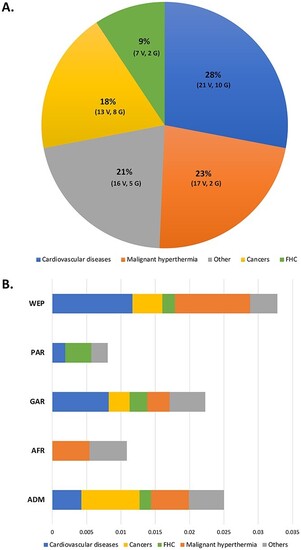
Distribution of ACMG novel variants among disease categories and QGP sub-population. (A) Frequency of 74 filtered novel ACMG variants based on different disease categories. (B) Distribution of novel ACMG variants in the QGP sub-populations. Abbreviations: FHC; Familial hypercholesteremia, GAR; General Arabs, PAR; Peninsular Arabs, WEP; Arabs of Western Eurasia and Persia, AFR; Arabs with African ancestry, ADM; Admixed, V; variants, G; genes.

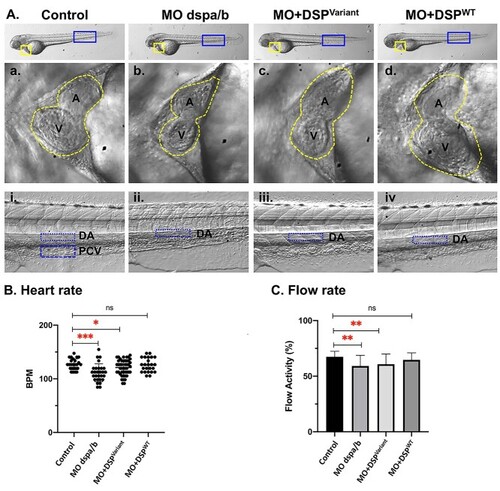
Zebrafish DSP Model Cardiac examination at 72 hours post fertilization (hpf). Modeling Qatar Genome Programme human DSP cardiac variant produced specific cardiac phenotype in the zebrafish model, representative heart images at 72 hours post-fertilization (hpf): (A) Zebrafish larvae at 72 hpf showing the two chambered heart (yellow square) and dorsal aorta flow rate (blue rectangle) images at 32X magnification. Representative images of the heart chambers; atrium (a) and ventricle (v) (traced with yellow dotted line) in the zebrafish experimental groups (control, Morpholino injected (MO dspa/b), human synthetic RNA of variant DSP c.1841A > G (p.Asp614Gly) (MO + DSPVariant) and wild-type (MO + DSPWT) co-injected with corresponding MO targeting the endogenous zebrafish transcript). (B) Heart rate for each individual fish was calculated as beats per minute (bpm) for the four experimental groups. Each dot represents an animal. Average heart rate of each group was compared to the control group. (C) The analysis of the vascular parameters was performed to calculate the blood flow rate within a selected area of the blood vessel (dorsal aorta). Average blood flow activity of each group was compared to the control group. Control (n = 25), dspa/b MO (n = 28), MO + DSPVariant (n = 46), and MO + DSPWT (n = 24). ns: not significant.

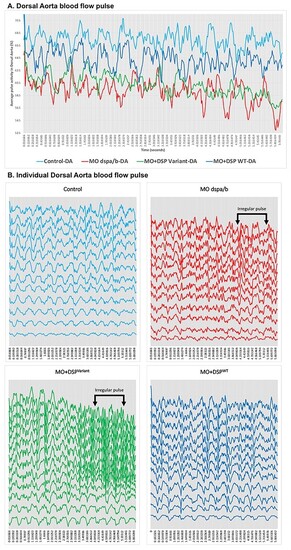
Zebrafish DSP model cardiac blood flow pulse in Dorsal Aorta. Modeling Qatar Genome Programme human DSP cardiac variant produced altered blood flow pulse in the dorsal aorta (DA) of the zebrafish model, representative charts at 72 hours post-fertilization (hpf): (A) Video recordings of high-speed acquisition of the blood flow (60 frames per second) were processed, a selected area of the DA with circulating red blood cells was used to calculate the cardiac blood flow pulse. A representative flow profiles chart for the analysis provides a color-coded pulse over time (6 s). (B) Representative individual pulse of analyzed data (n = 12 per group).

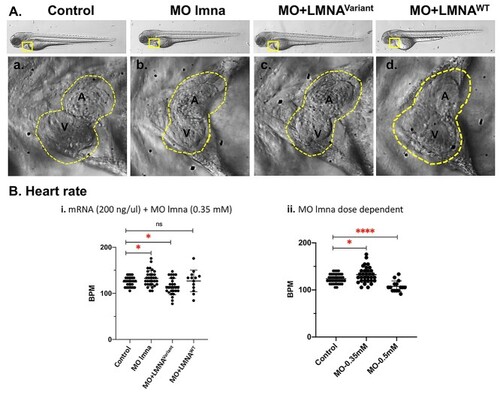
Zebrafish LMNA Model Cardiac examination at 72 hours post fertilization (hpf). Modeling Qatar Genome Programme human LMNA cardiac variant produced specific cardiac phenotype in the zebrafish model, representative heart images at 72 hpf: (A) Zebrafish larvae at 72 hpf showing the two chambered heart (yellow square), and dorsal aorta flow rate (blue rectangle). Zebrafish examined groups were control, Morpholino injected group (MO lmna), human synthetic RNA of variant LMNA c.326 T > G (p.Val109Gly) (MO + LMNAVariant) and wild-type (MO + LMNAWT) co-injected with corresponding MO targeting the endogenous zebrafish transcript. Representative images of the heart chambers; atrium (a) and ventricle (v) (traced with yellow dotted line). (B) Heart rate for each individual fish was calculated as beats per minute (bpm) for the four experimental groups. Each dot represents an animal. Average heart rate of each group was compared to the control group. i: Control (n = 30), lmna MO (n = 17), MO + LMNAVariant (n = 28), and MO + LMNAWT (n = 13). ii: Control (n = 42), MO_0.35 (n = 32) and MO_0.5 (n = 15). ns: not significant.

PHENOTYPE:
Fish:
Knockdown Reagent:
Observed In:
Stage: Protruding-mouth

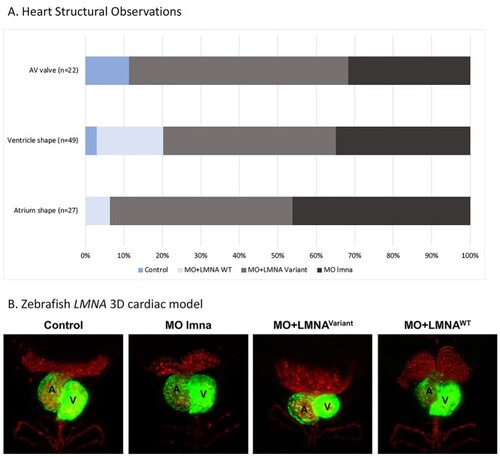
Zebrafish LMNA model heart structure abnormalities. Modeling Qatar Genome Programme human LMNA cardiac variant produced abnormal heart chambers in LMNA zebrafish model. (A) Proportion of heart abnormalities, including valve defects and abnormal heart chamber shape in the four experimental groups. (B) LMNA zebrafish heart 3D structure at 72 hours post fertilization (hpf). Transgenic embryos (Tg:gata1: dsRed, cmlc2:eGFP), expressing red fluorescent red blood cells and green hearts) showing the abnormal cardiac chambers structure (Atrium: A, Ventricle: V). AV valve: Control (n = 3), lmna MO (n = 5), MO + LMNAVariant (n = 14), and MO + LMNAWT (n = 0). Ventricular shape: Control (n = 2), lmna MO (n = 14), MO + LMNAVariant (n = 28), and MO + LMNAWT (n = 5). Atrium shape: Control (n = 0), MO (n = 10), MO + LMNAVariant (n = 16), and MO + LMNAWT (n = 1).

Acknowledgments
This image is the copyrighted work of the attributed author or publisher, and ZFIN has permission only to display this image to its users. Additional permissions should be obtained from the applicable author or publisher of the image. Full text @ Hum. Mol. Genet.