
- Title
-
Automatic wavelet-based 3D nuclei segmentation and analysis for multicellular embryo quantification
- Authors
- Wu, T.C., Wang, X., Li, L., Bu, Y., Umulis, D.M.
- Source
- Full text @ Sci. Rep.
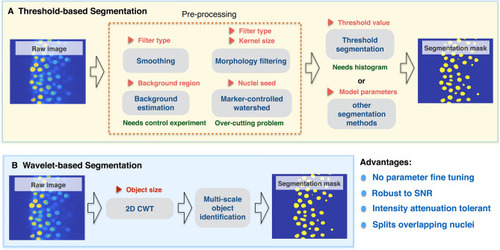
Comparison between threshold-based segmentation and wavelet-based segmentation methods. Preprocessing steps are crucial for most threshold-based segmentation methods and determine the quality of segmentation performance. Increased parameter numbers in preprocessing steps and segmentation method increases result complexity. Red triangle symbols indicate parameters required for each step and may need parameter fine tuning. |
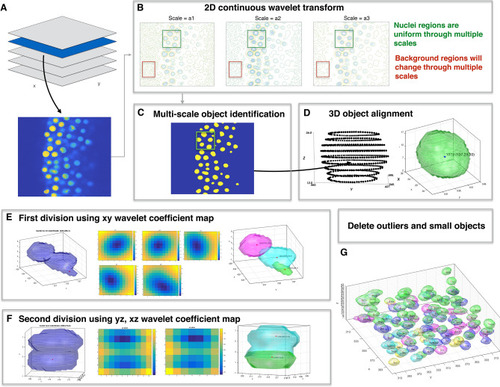
Overview of wavelet-based nuclei segmentation method. ( |
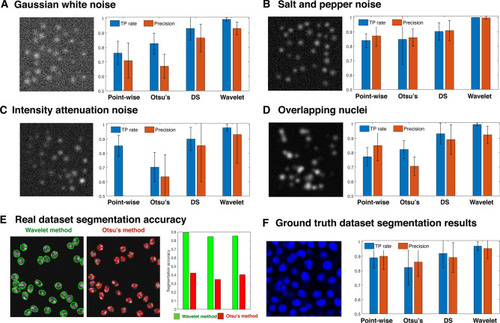
Performance criteria and segmentation accuracy of four segmentation methods on synthetic images and ground truth image datasets. ( |
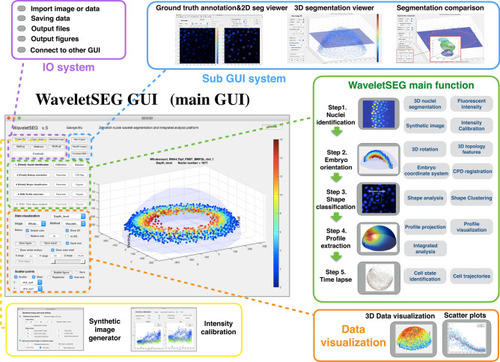
WaveletSEG software main function structure and GUI. WaveletSEG is the image processing analysis platform which integrates all main and extension functions including IO system, extension GUI and data visualization system in one GUI. The WaveletSEG main function block consists of five main steps that can run independently including 1. Nuclei identification, 2. Embryo orientation, 3. Shape classification, 4. Profile extraction, and 5. Time lapse steps. In the nuclei identification step, users can do intensity calibration by using nuclei intensity or after wavelet-based segmentation. In IO system block, users can directly import microscope image files or intermediate data files into WaveletSEG, and save or output data results or figures directly from the GUI. We also developed a set of segmentation validation tools in WaveletSEG including synthetic data generator, 3D ground truth labeling system, 2D and 3D segmentation viewer sub-GUI, and segmentation method comparison extension GUI. In WaveletSEG data visualization block, 3D segmentation and quantification or other results such as embryo topology features can be easily displayed or saved in the WaveletSEG data visualization system. User can also create scatter plots by selecting menu options to explore the relationship between them. |
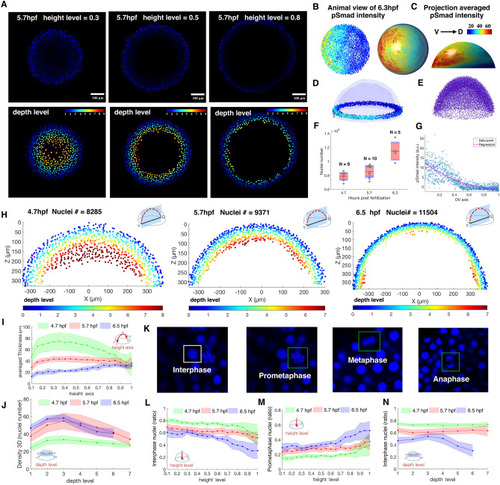
Example quantification of nuclear pSMAD gradient in Zebrafish embryo and spatial analysis of embryo coordinate system, 3D topology features and cell cycle phase patterns between 4.7, 5.7, 6.5 hpf Zebrafish embryo. (A) Z-slice DAPI nuclear stain (upper) and depth level for each nucleus on height level?=?0.3, 0.5, 0.8 in 5.7 hpf Zebrafish embryo (lower). (B, C) Animal view of nuclear pSMAD intensity of all nuclei from the 6.3hpf embryo (left), and animal and lateral view of averaged pSMAD intensity by projecting to uniform distributed semisphere surface using WaveletSEG (center and right). (D) Data visualization of nuclear pSMAD intensity for 6.5 hpf Zebrafish embryo in marginal region using WaveletSEG. Light blue and dark blue transparent shells indicate inner and outer boundary surfaces of all nuclei in embryo. (E) Embryo alignment using coherent point drift (CPD) method in WaveletSEG. (F) Nuclei number counts of embryo vs different developmental time (4.7hpf: N?=?9, 5.7hpf: N?=?10, 6.5hpf: N?=?5) which also applied in (i-j, l-n). Gray dots are individual embryo nuclei number. Red line red box region, and blue region show the mean nuclei number, 95% confidence region and region between one standard deviation. (G) Distribution of nuclear pSMAD intensity vs DV axis in embryo margin region in (C). Blue dot and red line indicate individual nuclei intensity and averaged intensity along DV axis. (H) Depth level spatial distribution for nuclei in DV direction cross section plane?�?30 um of 4.7 hpf (left), 5.7 hpf (center) and 6.5hpf Zebrafish embryo (right). (I) Averaged nuclear layer thickness through embryo height axis in 4.7, 5.7 and 6.5hpf embryo developmental time. (J) Averaged nuclear density through embryo height axis in 4.7, 5.7 and 6.5hpf embryo developmental time. Green, red and blue dark line indicate mean value, and light green, light red and light blue regions indicate one standard deviation region. (K) Examples of cell cycle phase in mitosis based on nuclei shape classification results. (L) Interphase nuclei count ratios through embryo height level in 4.7, 5.7 and 6.5 embryo developmental time. (M) Prometaphase nuclei count ratios through embryo height level in 4.7, 5.7 and 6.5 embryo developmental time. (N) Interphase nuclei count ratios through embryo depth level in 4.7, 5.7 and 6.5 embryo developmental time. (L?N) Green, red and blue dark lines indicate mean value, and light green, light red and light blue regions indicate one standard deviation region. |