- Title
-
Contributions of biliary epithelial cells to hepatocyte homeostasis and regeneration in zebrafish
- Authors
- Zhang, W., Chen, J., Ni, R., Yang, Q., Luo, L., He, J.
- Source
- Full text @ iScience
|
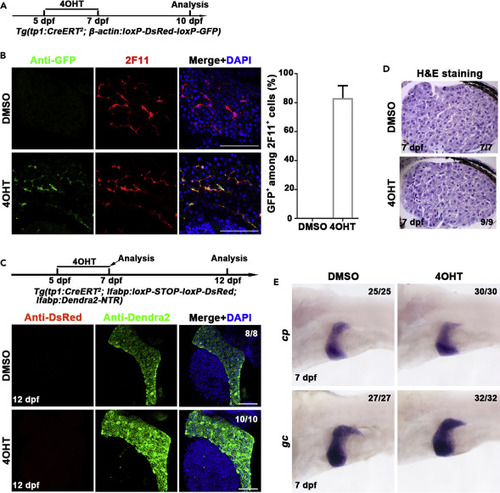
Establishment of the lineage tracing system specific for the detection of BEC-to-hepatocyte conversion (A) Experimental scheme illustrating the stage of 4OHT treatment to double transgenic line, Tg(tp1:CreERT2; ?-actin:loxP-DsRed-loxP-GFP) from 5 dpf to 7 dpf and analysis at 10 dpf. (B) Immunostaining for 2F11 and GFP on livers (2D imaging) showing tp1-CreER labels the 2F11-positive cholangiocytes specifically after 4OHT treatment. Nuclei were stained with DAPI (4',6-diamidino-2-phenylindole) (blue). Quantification of the percentage of GFP+ among 2F11+ cells in DMSO- (n = 5) and 4OHT (n = 6)-treated livers at 10 dpf. (C) Experimental scheme illustrating the stage of 4OHT treatment to triple transgenic line Tg(tp1:CreERT2; lfabp: loxP-STOP-loxP-DsRed; lfabp:Dendra2-NTR) from 5 dpf to 7 dpf and analysis at 12 dpf. Immunostaining for DsRed and Dendra2 in livers (3D imaging) showing no DsRed positive cells in Dendra2+ cells. Nuclei were stained with DAPI (blue). (D) H&E staining images showing normal liver histologies at 7 dpf after DMSO and 4OHT treatment. (E) Whole-mount in situ hybridization images showing the expression of cp and gc in DMSO and 4OHT treatment at 7 dpf. Scale bars: 100 ?m. Data are represented as mean ąSEM?Standard Error of Mean?. See also Figure S1. |
|
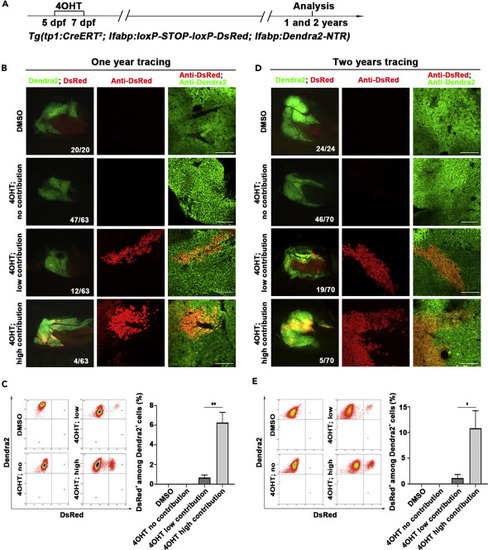
Tp1-positive BECs contribute to physiological hepatocyte homeostasis in a portion of zebrafish adults (A) Experimental scheme illustrating the stage of 4OHT treatment to triple transgenic line Tg(tp1:CreERT2; lfabp:loxP-STOP-loxP-DsRed; lfabp:Dendra2-NTR) from 5 dpf to 7 dpf and analysis at 1 and 2 years. (B) Live images showing the expression of Dendra2 and DsRed in the adult livers at 1 year. Co-immunostaining for Dendra2 and DsRed in the liver sections after DMSO and 4OHT treatment. (C) Fluorescence activating cell sorter (FACS) analysis showing the ratio of DsRed+ among Dendra2+ cells in DMSO- and 4OHT-treated livers. Quantification of the percentage of DsRed+ among Dendra2+ cells in DMSO- (n=3) and 4OHT-treated (no contribution, n=3; low contribution, n=4; high contribution, n=3) livers at 1 year. (D) Live images showing the expression of Dendra2 and DsRed in the adult livers at 2 years. Many clusters of DsRed+ cells among livers in 4OHT-treated groups. Co-immunostaining for Dendra2 and DsRed in the liver after DMSO and 4OHT treatment. (E) Fluorescence activating cell sorter (FACS) analysis showing the ratio of DsRed+ among Dendra2+ cells in DMSO- and 4OHT-treated livers. Quantification of the percentage of DsRed+ among Dendra2+ cells in DMSO- (n=5) and 4OHT-treated (no contribution, n=4; low contribution, n=5; high contribution, n=3) livers at 2 years. Numbers indicate the proportion of larvae exhibiting the expression shown. Asterisks indicate statistical significance: ?p<0.05, ??p<0.01, and p value was calculated by Student t tests. Scale bars: 100 ?m. Data are represented as mean ąSEM. |
|
Krt18-positive BECs contribute to physiological hepatocyte homeostasis in a portion of zebrafish adults (A) Experimental scheme illustrating the stage of 4OHT treatment to triple transgenic line Tg(krt18:CreERT2; lfabp:loxP-STOP-loxP-DsRed; lfabp:Dendra2-NTR) from 10 dpf to 11 dpf and analysis at 1 year. (B) Live images showing the expression of Dendra2 and DsRed in the adult livers at 1 year. Co-immunostaining for Dendra2 and DsRed in DMSO- and 4OHT-treated livers. (C) Fluorescence activating cell sorter (FACS) analysis shows the ratio of DsRed+ among Dendra+ cells in DMSO- and 4OHT-treated livers. Quantification of the percentage of DsRed+ among Dendra2+ cells in DMSO- (n=5) and 4OHT-treated (no contribution, n=5; low contribution, n=8; high contribution, n=3) livers at 1 year. Numbers indicate the proportion of larvae exhibiting the expression shown. Asterisks indicate statistical significance: ??p<0.01, and p value was calculated by Student t tests. Scale bars: 100 ?m. Data are represented as mean ąSEM. See also Figure S2. |
|
BECs act as the major contributor to hepatocyte regeneration after extreme injury to fibrotic liver (A) Experimental scheme illustrating the stage of EtOH and Mtz treatment in transgenic line Tg(lfabp:Dendra2-NTR). (B) Confocal projection images (3D imaging) showing the staining of extracellular matrix protein collagen 1 in the liver region (dashed lines) after DMSO, EtOH, Mtz, and Mtz plus EtOH treatment at R0h (arrows). (C) Confocal projection images (3D imaging) showing the co-immunostaining for Dendra2 and 2F11 in regenerating livers after EtOH and Mtz treatment from R0h to R72h. (D) Single optical images showing the co-immunostaining for Dnedra2 and DsRed in regenerating livers at R24h. Most of the Dendra2+ cells are 2F11 positive in Mtz and EtOH treatment (arrows). In EtOH treatment, the 2F11+ and Dendra2+ cells are not co-stained (arrowhead). Nuclei were stained with DAPI (blue). (E) Experimental scheme illustrating the stage of 4OHT and EtOH treatment to double transgenic line, Tg(tp1:CreERT2; ?-actin:loxP-DsRed-loxP-GFP), from 4 dpf to 5 dpf and analysis at 6 dpf. Immunostaining for 2F11 and GFP on livers (2D imaging) showing tp1-CreER labels the 2F11-positive cholangiocytes specifically after 4OHT and EtOH treatment. Nuclei were stained with DAPI (blue). Quantification of the percentages of GFP+ among 2F11+ hepatocytes (EtOH, n=5; EtOH+4OHT, n=8). (F) Experimental scheme illustrating the stage of 4OHT, EtOH, and Mtz treatment to triple transgenic line Tg(tp1:CreERT2; lfabp:loxP-STOP-loxP-DsRed; lfabp:Dendra2-NTR) and analysis at R72h. Single optical images showing the co-immunostaining for DsRed and Dendra2 at R72h after 4OHT, EtOH, and Mtz treatment. Quantification of the percentage of the DsRed+ among the Dendra2+ cells in regenerating livers at R72h (EtOH+4OHT, n=10; EtOH+4OHT+Mtz, n=10). Numbers indicate the proportion of larvae exhibiting the expression shown. Scale bars: 100 ?m. Data are represented as mean ąSEM. See also Figures S4 and S5. |
|
BECs fail to contribute to hepatocyte regeneration after PH (A) Live images showing the liver (Green) after PH at 0 hpp. (B) Confocal projection showing (3D imaging) the co-immunostaining for Dendra2 and 2F11 at 1 dpp. (C) Single optical images showing the co-immunostaining for Dendra2 and 2F11 at 1 dpp. The 2F11+ (BECs) were Dnedra2-. Nuclei were stained with DAPI (blue). (D) Experimental scheme illustrating the stage of 4OHT and PH and analysis at 2 wpp in triple transgenic line Tg(tp1:CreERT2; lfabp:loxP-STOP-loxP-DsRed; lfabp:Dendra2-NTR). (E) The confocal projection shows that no DsRed expression in regenerating livers at 2 wpp. (F) The confocal projection (3D imaging) shows that no DsRed expression at 2 wpp in large magnification. Numbers indicate the proportion of larvae exhibiting the expression shown. Scale bars: 100 ?m. hpp: hours post-partial hepatectomy; dpp: days post-partial hepatectomy; wpp: weeks post-partial hepatectomy. |
|
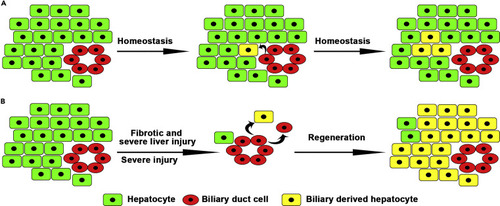
BECs contribute to physiological hepatocyte homeostasis and fibrotic and severe liver regeneration (A) A subset of BECs contribute to physiological hepatocyte homeostasis. (B) BEC transdifferentiations are the main cellular sources for fibrotic/severe and severe liver regeneration. |


