FIGURE SUMMARY
Title

The single nucleotide variant at c.662A>G in human RRM2B is a loss-of-function mutation

Authors
Tseng, Y.T., Li, S.W., HuangFu, W.C., Yen, Y., Liu, I.H.
Source
Full text @ Mol Genet Genomic Med

ZFIN is incorporating published figure images and captions as part of an ongoing project. Figures from some publications have not yet been curated, or are not available for display because of copyright restrictions.

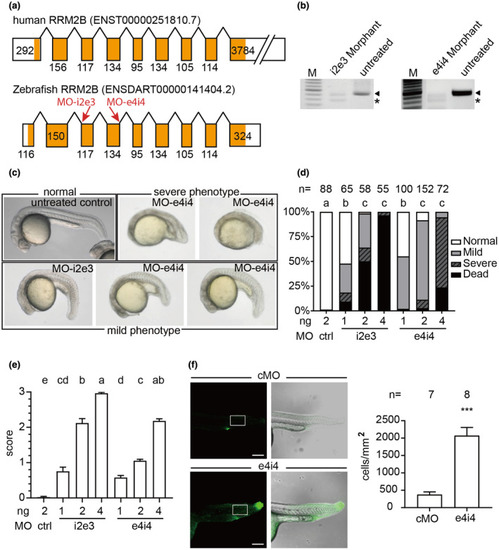
Phenotypic characterization of rrm2b knocked down zebrafish. (a) Comparison between human RRM2B and zebrafish rrm2b transcripts indicates a high conservation through evolution. The exons were presented as boxes and the coding regions were shaded in orange. Length of each exon was indicated at each box. The target sites for MOs are as indicated on zebrafish rrm2b transcripts. (b) RT‐PCR analysis of rrm2b from untreated control, MO‐i2e3, and MO‐e4i4 morphants indicate that both MOs targeting zebrafish rrm2b disrupt the maturation of rrm2b mRNA and result in exon skipping. (c) The micrographs of MO‐i2e3 and MO‐e4i4 morphants at 24 hpf were classified into four groups: normal, mild, severe, and dead according to the severity. (d) Penetrances of characterized phenotypes, normal, mild, severe, and dead, in MO‐control (ctrl), MO‐i2e3 (i2e3), or MO‐e4i4 (e4i4)‐treated zebrafish embryos were calculated and compared. The ratio of normal embryo was statistically analyzed. Different lowercase letters on top of the histograms represented significant differences (p < 0.05) among groups. (e) The morphants were scored as 0, 1, 2, and 3 for different phenotypic severity: normal, mild, severe, and death, respectively. The scores of severity were statistically analyzed. Different lowercase letters on top of the histograms represented significant differences among groups (p < 0.05 for statistical significance). (f) Dead cells were labeled by acridine orange emitting green fluorescence in the confocal micrographs. In MO‐control morphants, sporadic dead cells were stained with more emphasis at the posterior end of the yolk extension while MO‐e4i4 morphants showed drastically more dead cells throughout the body. The green fluorescence positive cells within the selected area were calculated (***p < 0.001)

Acknowledgments
This image is the copyrighted work of the attributed author or publisher, and ZFIN has permission only to display this image to its users. Additional permissions should be obtained from the applicable author or publisher of the image. Full text @ Mol Genet Genomic Med