- Title
-
Astrocytes influence medulloblastoma phenotypes and CD133 surface expression
- Authors
- Gronseth, E., Gupta, A., Koceja, C., Kumar, S., Kutty, R.G., Rarick, K., Wang, L., Ramchandran, R.
- Source
- Full text @ PLoS One
|
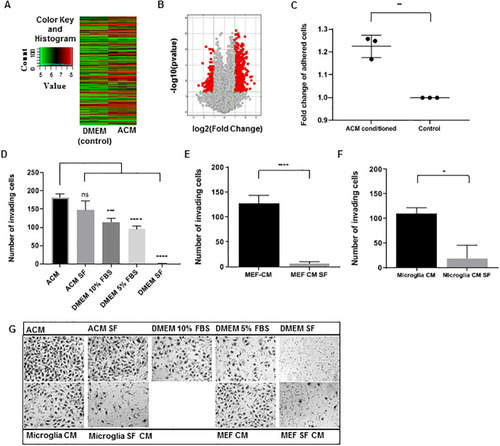
(A) Hierarchical clustering heat map of differentially expressed genes in Astrocyte Conditioned Media (ACM) cultured cells compared to DMEM cultured (control) cells. Image modified from Arraystar (Rockville, MD) (B) Volcano plot of differentially expressed genes between ACM cultured and control cells. The |
|
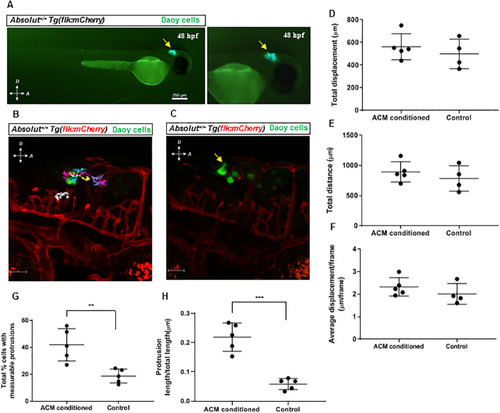
(A) Representative images of cells (yellow arrow) after injection into the hindbrains of 48 hpf EXPRESSION / LABELING:
|
|
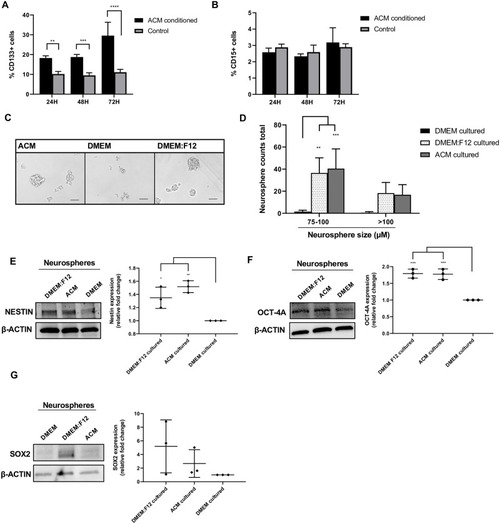
(A) Percentage of CD133 positive cells cultured in ACM or DMEM (control), measured by flow cytometry at 24, 48, and 72 h. (B) Percentage of CD15 positive cells cultured in ACM or DMEM (control), measured by flow cytometry at 24, 48, and 72 h. (C) Representative images of Daoy cells cultured in neurosphere conditions using the respective media for 48 h. Scale bar is 100 μm. (D) Total number of neurospheres counted in all images between 75–100 μm or >100 μm at 48 h, cultured in the respective media. (E) Western blot analysis of Nestin, (F) Oct-4A and (G) Sox2 expression in respective neurosphere culturing conditions at 48 h. β-actin served as a loading control (left). Quantification of relative fold change of Nestin, Oct-4A and Sox2 expression, measured by the densitometry of western blot bands and normalized to β-actin (DMEM condition set to 1) (right). Quantified values expressed as mean +/- SD. *p<0.05, **p<0.01, ***p<0.001, ****p<0.0001. |
|
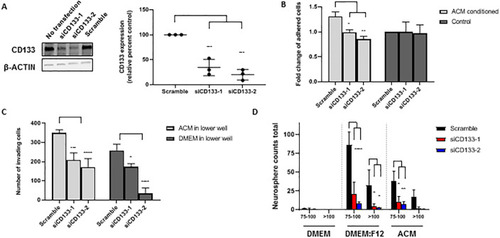
(A) Western blot analysis of CD133 expression 48 h after transfection with |


