FIGURE SUMMARY
Title

Zebrafish B cell acute lymphoblastic leukemia: new findings in an old model

Authors
Park, G., Burroughs-Garcia, J., Foster, C.A., Hasan, A., Borga, C., Frazer, J.K.
Source
Full text @ Oncotarget

B-ALL in <italic>hMYC</italic> zebrafish.

(A) Curves displaying B- and T-ALL incidence by 184 dpf, as determined by fluorescence microscopy. (B) Fluorescence microscopy images of fish with B-ALL (left), both B- and T-ALL (center), or T-ALL (right). Flow cytometry plots of ALL samples from these fish are shown beneath them. (C) B-ALL appearance in fish with rag2:hMYC and different transgenic markers: cd79a:GFP (left), cd79b:GFP (center), or lck:GFP (right). WT cd79a:GFP or cd79b:GFP fish without B-ALL are shown beneath for comparison. Images are representative of > 50 animals examined for each genotype.

B-ALL regress with DXM or IR treatments.

(A) B-ALL in rag2:hMYC fish treated with DXM for 9 days (n = 19). Post-treatment and relapsed images were obtained on days 9 and 28, respectively. Every (19/19) B-ALL regressed after DXM, but 11/19 (58%) B-ALL relapsed by day 28 (19 days after DXM withdrawal). (B) B-ALL in rag2:hMYC fish treated with IR (n = 13). Post-treatment and relapsed images were obtained on days 7 (i. e., 2 days after the 2nd IR dose) and 23, respectively. Every B-ALL (13/13) regressed after IR, but 100% recurred within 3 weeks of the 2nd IR dose. Upon relapse, flow cytometric testing (See Figure 1B) was used to verify that each relapse was GFPlo B-ALL. Images of rag2:hMYC, lck:GFP fish (top 5 animals) have had brightness enhanced to facilitate visualization of dim B-ALL. Images of the rag2:hMYC, cd79a:GFP fish (lowest animal) are unmodified.

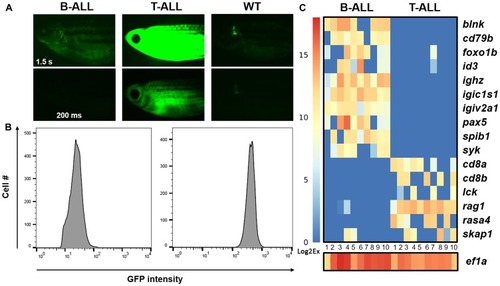
Gene expression in individual <italic>hMYC</italic> B- and T-ALL cells.

(A) rag2:hMYC;lck: GFP fish with dim (left) and bright (center) cancers. B-ALL is only visible with 1.5 s exposure (upper left); T-ALL is visible with either 1.5 s (upper middle) or 200 ms (lower middle) exposures. Control lck:GFP fish images are shown at right, where only the thymus is visible. (B) Flow cytometry plots of the same ALL samples demonstrate GFPlo B-ALL and GFPhi T-ALL specimens. (C) Gene expression in single B- and T-ALL cells of the same cancers (n = 10 cells for each), as determined by Fluidigm™ Biomark qRT-PCR. B-ALL cells express B cell, but not T cell, genes; T-ALL show the opposite pattern. Expression of eef1a1l1 (homologue of human eukaryotic translation elongation factor 1 alpha 1, aka EF1A) was used as a threshold control for the presence of RNA in each well. CT values were converted to Log2Ex for visualization (scale bar at left).

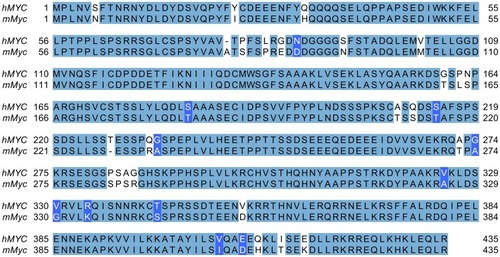
Alignment of human and murine MYC proteins.

Transgenic human and mouse MYC are 435 and 439 amino acids, respectively (last four mMyc residues not shown). Proteins show > 91% identity (399 residues, shaded light blue) and > 94% similarity (410 residues; 11 additional similar residues shaded darker blue).

Differentially-expressed genes in <italic>hMYC</italic> versus <italic>mMyc</italic> B-ALL.

(A) Heatmap depicting 62 differentially-expressed mRNA, including genes of the Gene Ontology (GO) RNA binding pathway (blue bar), D. rerio fos/jun-family members (green bar), endogenous myc-family members (red bar), and other myc-related proteins, including several max heterodimeric partners (purple bar). Samples hMYC-1, -3, -4, and -5 are four distinct hMYC B-ALL; 9.2A/B and 10.2A/B pairs are RNA-seq technical replicates of two mMyc B-ALL [57, 60]. Genes not meeting differential expression testing thresholds or other filtering criteria are marked by asterisks (FDR < 0.05, absolute fold-change ≥ 1.5). Read counts are shown as z-scores (scale bar at left). (B) Top ten biologic pathways up-regulated in hMYC (top) or mMyc B-ALL (bottom; FDR < 0.05). Pathways are ordered according to the number of genes detected in the gene set (x-axis) and colored based on FDR q-value. Data point sizes correspond to the percentage of genes over-expressed in each pathway.

Acknowledgments
This image is the copyrighted work of the attributed author or publisher, and ZFIN has permission only to display this image to its users. Additional permissions should be obtained from the applicable author or publisher of the image. Full text @ Oncotarget