FIGURE SUMMARY
Title

Anti-angiogenic effects of VEGF stimulation on endothelium deficient in phosphoinositide recycling

Authors
Stratman, A.N., Farrelly, O.M., Mikelis, C.M., Miller, M.F., Wang, Z., Pham, V.N., Davis, A.E., Burns, M.C., Pezoa, S.A., Castranova, D., Yano, J.J., Kilts, T.M., Davis, G.E., Gutkind, J.S., Weinstein, B.M.
Source
Full text @ Nat. Commun.

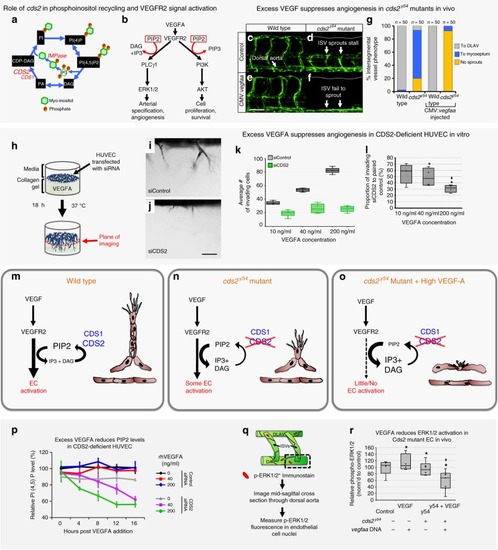
CDS2 dependent angiogenic sprouting defects in vitro and in vivo are exacerbated by exogenous VEGFA addition.

a Schematic diagram of phosphoinositide recycling. CDS1, CDS2, and IMP enzymes facilitate regeneration of phosphoinositol after consumption of PIP2 (see Fig. S12 for details). b VEGFR2 signaling schematic (modified from refs. 36,60). cg Confocal images (cf) and quantitation (g) of trunk intersegmental vessels (ISV) in 32hpf Tg(fli1a:egfp)y1 WT siblings (c, e) or cds2y54 mutants (d, f) injected with control (c, d) or CMV:vegfaa (e, f) DNA. Bars in g measure ISV that have not sprouted (yellow), grown halfway up the trunk (blue), or formed a complete ISV (gray). Data is representative of three different experiments, n = 50 ISVs per treatment group. hj HUVEC 3D invasion assay used to model angiogenesis in vitro (h), with representative images from control and CDS2 siRNA-treated cultures (i, j). k Quantification of HUVEC cellular invasion into collagen gels at VEGFA doses indicated (n = 4 collagen gels; data is representative of three independent experiments). l Quantification of CDS2 siRNA HUVEC cellular invasion normalized to VEGFA dose-matched controls (see methods); Star indicates significance from control; plus indicates significance from individual VEGFA doses (t-test). mo Schematic model for phosphoinositide recycling, CDS2, and angiogenesis. m Under normal conditions phosphoinositide recycling maintains PIP2 levels and VEGFA signal transduction. n Endothelium defective for CDS2 has a reduced capacity to recycle phosphoinositides, but under conditions of initial or low-level VEGFA stimulation sufficient PIP2 is regenerated to maintain VEGFA signal transduction. o During sustained and/or high-level VEGFA stimulation, however, PIP2 levels cannot be maintained, leading to a collapse of VEGFA signal transduction. p ELISA quantitation of PIP2 levels in control or CDS2 siRNA-treated HUVECs incubated with 0, 40, or 200 ng/ml VEGFA over a 16 h time course, normalized to levels in initial control siRNA-treated HUVEC without added VEGFA. Nine technical replicates were measured per sample, per experiment. Data is graphed as the average of two experimental replicates. q Diagram illustrating procedure for measurement of phospho-ERK1/2 in trunk endothelial nuclei by immunofluorescence. r Quantitation of trunk endothelial phospho-ERK1/2 in 30 hpf cds2y54 mutants and WT siblings ± (with/without) CMV:vegfaa DNA (column 1 n = 5 biologically independent animals; column 2 n = 4 biologically independent animals; column 3 n = 6 biologically independent animals; column 4 n = 7 biologically independent animals), data is representative of two independent experiments. Star indicates significance from control; plus indicates significance from cds2y54 mutant—CMV:vegfaa DNA condition (t-test). Bars = 100 μm. Box plots are graphed showing the median versus the first and third quartiles of the data (the middle, top, and bottom lines of the box, respectively). The whiskers demonstrate the spread of data within 1.5x above and below the interquartile range. All data points are shown as individual dots, with outliers shown above or below the whiskers.

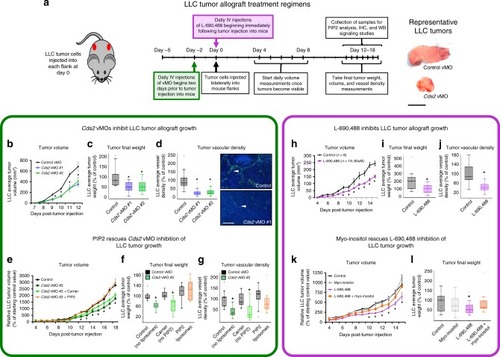
Anti-PIP2 recycling therapies suppress tumor growth.

a Schematic of Lewis Lung Carcinoma (LLC) tumor allograft assay with representative tumor images. Bar = 1 cm. b–gCds2 vMO treatment (n = 10 biologically independent tumors for all groups). hl L-690,488 small molecule inhibitor treatment (control n = 8 biologically independent tumors, L-690,488 n = 19 biologically independent tumors). Quantitation of average tumor volume (b, h), final tumor weight (c, i) and final tumor vascular density (d, j) at 12–15 days post-tumor implantation, in control versus Cds2 vMO or L-690,488-treated animals (bd versus hj). d Quantitation of average tumor vascular density and representative images of CD31/PECAM labeled (green) versus DAPI (blue) LLC tumor sections from control vMO (top) and Cds2 vMO (bottom) treated mice. White arrowheads indicate sites of CD31/PECAM positive blood vessel labeling. Bar = 100 μm. For all vascular density measurement experiments: three images per tumor were acquired and vascular density measured for all groups. A minimum of two slide sections from each tumor in bg (taken from sections at least 10 slices apart) were analyzed. Representative of three experimental replicates. e-g PIP2 “rescues” Cds2 vMO tumor inhibition. Quantitation of LLC average tumor volume (e), final tumor weight (f), and tumor vascular density (g) at 18 days post-tumor implantation in control vMO (n=8 biologically independent tumors), Cds2 vMO #2 (no liposomes, n = 9 biologically independent tumors), Cds2 vMO #2 + carrier liposome (no PIP2, n = 9 biologically independent tumors), or Cds2 vMO #2 + PIP2 loaded liposome-treated (n = 8 biologically independent tumors), LLC-allografted mice. Data in (e-g) are normalized to the average starting size of each individual tumor group at day 4, and shown as a percentage of the starting day 4 control (the PIP2 liposome injection start date). j Quantitation of average tumor vascular density of LLC tumor sections from control and L-690,488-treated mice. For all vascular density measurement experiments: three images per tumor were acquired and vascular density measured for all groups. A minimum of two slide sections from each tumor in h–l (taken from sections at least 10 slices apart) were analyzed. Representative of two experimental replicates. k, l Myo-inositol “rescues” L-690,488 tumor inhibition. Quantitation of LLC average tumor volume (k) and final tumor weight (l) at 15 days post-tumor implantation in control (untreated, n = 14 biologically independent tumors), myo-inositol (n = 11 biologically independent tumors), L-690,488 (n = 12 biologically independent tumors), or L-690,488 + myo-inositol (n = 10 biologically independent tumors) treated LLC-allografted mice. Data in (k, l) are normalized to the control condition. For all panels: p ≤ 0.05, error bars ± SEM. Star indicates significance from control (t-test). Box plots are graphed showing the median versus the first and third quartiles of the data (the middle, top, and bottom lines of the box, respectively). The whiskers demonstrate the spread of data within 1.5x above and below the interquartile range. All data points are shown as individual dots, with outliers shown above or below the whiskers.

Endothelial-specific genetic deletion of <italic>Cds2</italic> promotes tumor growth inhibition.

a Schematic of Lewis Lung Carcinoma (LLC) tumor allograft assay in endothelial-specific Cds2 knockout mice. b Representative tumor images from Vehicle Control (Cad5(PAC)-CreERT2;Cds2lox/lox); Cre, TMX Control (Cad5(PAC)-CreERT2 +TMX); and endothelial-specific Cds2 genetic deletion mice (Cad5(PAC)-CreERT2;Cds2lox/lox +TMX). Bar = 1 cm. c, d Quantitation of LLC average tumor volume (c) and final tumor weight (d) at 14 days post- tumor implantation in the eight genetic conditions tested. Data in c are normalized to the starting day 4 tumor volume of Wild type + TMX controls. e Representative western blot images of EC protein isolated from tumors for each indicated genetic condition, probed for CDS2 and tubulin as a loading control. Blots demonstrate that CDS2 protein is still reduced in Cad5(PAC)-CreERT2;Cds2lox/lox mice at day 14, after only a 5 day pulse of TMX treatment initiated prior to the start of the experiment. p ≤ 0.05, error bars ± SEM. *Significance from control (t-test). f, g Quantitation of average tumor vascular density (f) and average liver vascular density (g) of CD31/PECAM labeled LLC tumor and liver sections from control Wild type +TMX, control Cad5(PAC)-CreERT2 +TMX, control Cad5(PAC)-CreERT2;Cds2lox/+ +TMX, and endothelial-specific Cds2 genetic deletion Cad5(PAC)-CreERT2;Cds2lox/lox +TMX mice. For all vascular density measurement experiments: three images per tumor were acquired and vascular density measured for all groups. A minimum of two slide sections from each tumor (taken from sections at least 10 slices apart) were analyzed. p ≤ 0.05, error bars ± SEM. Star indicates significance from control (t-test). hk Representative images of CD31/PECAM labeled blood vessels in tumors from control Wild type +TMX, control Cad5(PAC)-CreERT2 +TMX, control Cad5(PAC)-CreERT2;Cds2lox/+ +TMX, and endothelial-specific Cds2 genetic deletion Cad5(PAC)-CreERT2;Cds2lox/lox +TMX mice. Bar =100 μm. Naming key: Wild type + TMX (no Cre, no Cds2 lox cassette; n = 18); Cad5(PAC)-CreERT2 +TMX (CreiECΔ only, +TMX; n = 13); Cad5(PAC)-CreERT2 (CreiECΔ only, no TMX vehicle control; n = 9); Cds2lox/lox +TMX (only homozygous Cds2 lox cassette, +TMX, no Cre; n = 6); Cds2lox/lox (only homozygous Cds2 lox cassette, no TMX vehicle control; n = 9); Cad5(PAC)-CreERT2;Cds2lox/+ +TMX (CreiECΔ, Cds2 heterozygous lox cassette, +TMX; n = 16); Cad5(PAC)-CreERT2;Cds2lox/lox +TMX (homozygous lox cassette, CreiECΔ, +TMX− experimental deletion group; n = 12); Cad5(PAC)-CreERT2;Cds2lox/lox (homozygous lox cassette, CreiECΔ, no TMX vehicle control; n = 7). Box plots are graphed showing the median versus the first and third quartiles of the data (the middle, top, and bottom lines of the box, respectively). The whiskers demonstrate the spread of data within 1.5x above and below the interquartile range. All data points are shown as individual dots, with outliers shown above or below the whiskers.

Systemic anti-PIP2 recycling therapies suppress VEGFR2 downstream signaling in LLC tumor models.

a Model for signaling in activated versus quiescent endothelium. b Diagram illustrating tissues isolated from mice and their use. c Quantification of vascular phospho-ERK1/2 (black bars) and phospho-AKT (gray bars) levels in immunostained liver or tumor tissue from LLC-allografted control animals (n = 8). d ELISA measurement of PIP2 levels in lung or tumor endothelial cells from LLC-allografted control animals. Data is the average of three experimental replicates. enCds2 vMO-treated, LLC-allografted mice. Quantification of PIP2 levels by ELISA in tumor (e) or lung (j) endothelial cells isolated from the same LLC-allografted animals. Data per treatment condition is graphed as the average of three experimental replicates. The ELISA measurements are normalized to whole cell tubulin lysates collected at the start of the lipid isolation procedure. Quantification of vascular phospho-ERK1/2 (f, k), phospho-AKT (g, l) and CDS2 (h, m) levels from immunostained sections of tumor (fh) or liver (km) tissue collected from the same LLC-allografted animals. For all immunostaining quantitation experiments: three images per individual tumor or liver were acquired and signal intensity measured for all groups. A minimum of two slide sections from each tumor or liver (taken from sections at least 10 slices apart) were utilized for independent analysis. Tumors, n = 10; Livers, n = 5. i, n Representative images of tumor (i) or liver (n) sections from control or Cds2 vMO-treated mice, double immunostained with phospho-ERK1/2 antibody (green images) and PECAM antibody (red images). ot L-690,488-treated, LLC-allografted mice. Quantification of vascular phospho-ERK1/2 (o, r) and phospho-AKT (p, s) levels from immunostained sections of tumor (o, p) or liver (r, s) tissue collected from the same LLC-allografted animals. q, t Representative images of tumor (q) or liver (t) sections from control (DMSO) or L-690,488-treated mice, double-immunostained with phospho-ERK1/2 antibody (green images) and PECAM antibody (red images). Control tumors, n = 8; L-690,488 tumors, n = 16; control livers, n = 4; L-690,488 livers, n = 8 p ≤  0.05, error bars ± SEM. Star indicates significance from control (t-test). Bars = 200 μm. Box plots are graphed showing the median versus the first and third quartiles of the data (the middle, top, and bottom lines of the box, respectively). The whiskers demonstrate the spread of data within 1.5x above and below the interquartile range. All data points are shown as individual dots, with outliers shown above or below the whiskers.

Systemic <italic>Cds2</italic> suppression inhibits growth of established tumors.

a Schematic of established tumor allograft assay. Lewis Lung Carcinoma (LLC) tumor cells were injected into each flank of adult B6/C57 mice at day 0 and tumors allowed to develop for 12–15 days. Daily intravenous injections of control vivoMorpholino (vMO) or vMO targeting one of two independent sites in the Cds2 gene (vMO #1 and vMO #2) were started at day 4 after tumor implantation. Volume measurements were taken daily starting at day 4, when tumors became visible and vMO treatment started, with final tumor volumes and weights taken at the termination of the experiment. b Quantitation of daily average tumor volume (in mm3) of LLC tumors, normalized to the average starting size of each tumor condition at day 4 (the injection start date). c Quantitation of average tumor weight (in mg) of LLC tumors at 14 days post-tumor implantation. Control vMO (n = 9); Cds2 vMO #1 (n = 8); Cds2 vMO #2 (n = 6). d Images of tumors collected from control vMO or Cds2 vMO-treated animals at 14 days post-tumor implantation. Bar = 1 cm. e Quantitation of LLC tumor vessel density in control vMO- versus Cds2 vMO-treated mice. fh Representative images of CD31/PECAM labeled (green) LLC tumor sections from control vMO (f) and Cds2 vMO (g, h) treated mice. White arrowheads indicate sites of CD31/PECAM positive blood vessel labeling. For all vascular density measurement experiments, three images per tumor were acquired (see tumor numbers above) and vascular density measured for all groups. A minimum of two slide sections from each tumor (taken from sections at least 10 slices apart) were utilized for independent analysis. Bar = 100 μm. Box plots are graphed showing the median versus the first and third quartiles of the data (the middle, top, and bottom lines of the box, respectively). The whiskers demonstrate the spread of data within 1.5x above and below the interquartile range. All data points are shown as individual dots, with outliers shown above or below the whiskers.

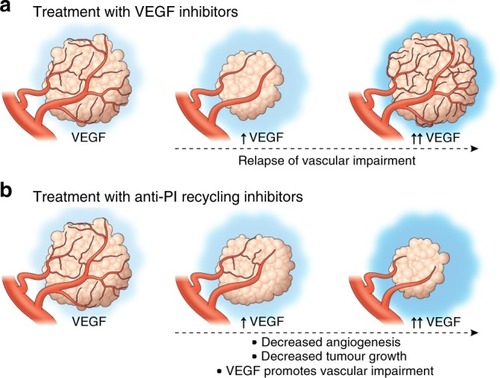
Proposed model for inhibition of tumor growth with anti-VEGF versus anti-PI recycling therapies.

a Currently available anti-angiogenic therapies targeting VEGF lead to an initial decrease in tumor growth and angiogenesis. However, production of high levels of pro-angiogenic ligands by tumors results in a relapse in vascular impairment and return of tumor growth. b Our results indicate that targeting PI recycling leads to reduced tumor vasculature and tumor growth, and further suggest that the effects on tumor angiogenesis and tumor growth may be strengthened, not overcome, as tumor production of VEGFA and/or other cytokines increases.

ZFIN is incorporating published figure images and captions as part of an ongoing project. Figures from some publications have not yet been curated, or are not available for display because of copyright restrictions.

ZFIN is incorporating published figure images and captions as part of an ongoing project. Figures from some publications have not yet been curated, or are not available for display because of copyright restrictions.

ZFIN is incorporating published figure images and captions as part of an ongoing project. Figures from some publications have not yet been curated, or are not available for display because of copyright restrictions.

ZFIN is incorporating published figure images and captions as part of an ongoing project. Figures from some publications have not yet been curated, or are not available for display because of copyright restrictions.

EXPRESSION / LABELING:
Antibody:
Fish:
Knockdown Reagent:
Anatomical Term:
Stage: Prim-15
PHENOTYPE:
Fish:
Knockdown Reagent:
Observed In:
Stage: Prim-15
Acknowledgments
This image is the copyrighted work of the attributed author or publisher, and ZFIN has permission only to display this image to its users. Additional permissions should be obtained from the applicable author or publisher of the image. Full text @ Nat. Commun.