IMAGE

Fig. 1

ID
ZDB-IMAGE-200310-12
Source
Figures for Stratman et al., 2020
Image
Figure Caption

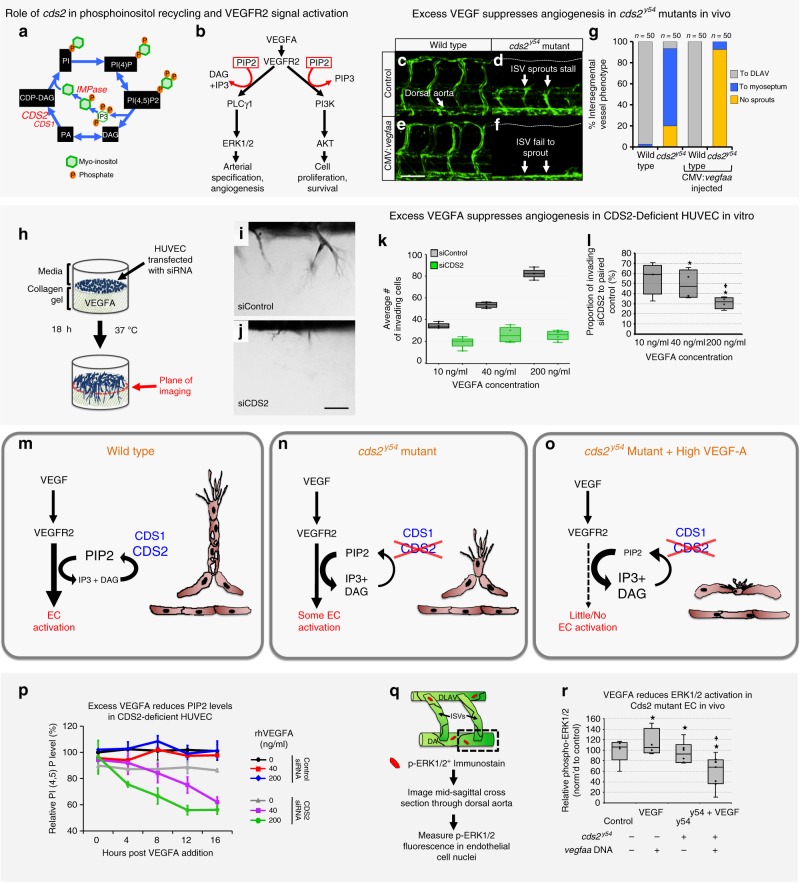
Fig. 1 CDS2 dependent angiogenic sprouting defects in vitro and in vivo are exacerbated by exogenous VEGFA addition.

a Schematic diagram of phosphoinositide recycling. CDS1, CDS2, and IMP enzymes facilitate regeneration of phosphoinositol after consumption of PIP2 (see Fig. S12 for details). b VEGFR2 signaling schematic (modified from refs. 36,60). cg Confocal images (cf) and quantitation (g) of trunk intersegmental vessels (ISV) in 32hpf Tg(fli1a:egfp)y1 WT siblings (c, e) or cds2y54 mutants (d, f) injected with control (c, d) or CMV:vegfaa (e, f) DNA. Bars in g measure ISV that have not sprouted (yellow), grown halfway up the trunk (blue), or formed a complete ISV (gray). Data is representative of three different experiments, n = 50 ISVs per treatment group. hj HUVEC 3D invasion assay used to model angiogenesis in vitro (h), with representative images from control and CDS2 siRNA-treated cultures (i, j). k Quantification of HUVEC cellular invasion into collagen gels at VEGFA doses indicated (n = 4 collagen gels; data is representative of three independent experiments). l Quantification of CDS2 siRNA HUVEC cellular invasion normalized to VEGFA dose-matched controls (see methods); Star indicates significance from control; plus indicates significance from individual VEGFA doses (t-test). mo Schematic model for phosphoinositide recycling, CDS2, and angiogenesis. m Under normal conditions phosphoinositide recycling maintains PIP2 levels and VEGFA signal transduction. n Endothelium defective for CDS2 has a reduced capacity to recycle phosphoinositides, but under conditions of initial or low-level VEGFA stimulation sufficient PIP2 is regenerated to maintain VEGFA signal transduction. o During sustained and/or high-level VEGFA stimulation, however, PIP2 levels cannot be maintained, leading to a collapse of VEGFA signal transduction. p ELISA quantitation of PIP2 levels in control or CDS2 siRNA-treated HUVECs incubated with 0, 40, or 200 ng/ml VEGFA over a 16 h time course, normalized to levels in initial control siRNA-treated HUVEC without added VEGFA. Nine technical replicates were measured per sample, per experiment. Data is graphed as the average of two experimental replicates. q Diagram illustrating procedure for measurement of phospho-ERK1/2 in trunk endothelial nuclei by immunofluorescence. r Quantitation of trunk endothelial phospho-ERK1/2 in 30 hpf cds2y54 mutants and WT siblings ± (with/without) CMV:vegfaa DNA (column 1 n = 5 biologically independent animals; column 2 n = 4 biologically independent animals; column 3 n = 6 biologically independent animals; column 4 n = 7 biologically independent animals), data is representative of two independent experiments. Star indicates significance from control; plus indicates significance from cds2y54 mutant—CMV:vegfaa DNA condition (t-test). Bars = 100 μm. Box plots are graphed showing the median versus the first and third quartiles of the data (the middle, top, and bottom lines of the box, respectively). The whiskers demonstrate the spread of data within 1.5x above and below the interquartile range. All data points are shown as individual dots, with outliers shown above or below the whiskers.

Figure Data
Acknowledgments
This image is the copyrighted work of the attributed author or publisher, and ZFIN has permission only to display this image to its users. Additional permissions should be obtained from the applicable author or publisher of the image. Full text @ Nat. Commun.