- Title
-
Origin and role of the cerebrospinal fluid bidirectional flow in the central canal
- Authors
- Thouvenin, O., Keiser, L., Cantaut-Belarif, Y., Carbo-Tano, M., Verweij, F., Jurisch-Yaksi, N., Bardet, P.L., van Niel, G., Gallaire, F., Wyart, C.
- Source
- Full text @ Elife
|
( |
|
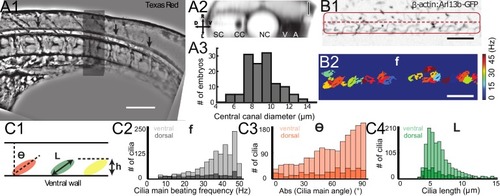
Geometry of the central canal and properties of motile cilia in 30 hpf embryos. (A1, A2) Central canal filled with TexasRed injected in the brain ventricles shown laterally from maximal Z-projection stack of 75 inverted contrast images acquired with 1 ?m Z-step (A1) and corresponding vertical profile (A2, 5x rescale on the axial dimension enabled similar pixel size in X/Y and Z): SC, spinal cord, CC, central canal (black arrows in (A1)), NC, notochord, V, vein and A, artery. (A3) Histogram of central canal diameter from n = 129 WT embryos, with a median value of 8.9 ± 0.9 ?m (mean ± 0.5 s.t.d.). (B1, B2) Lateral view in the CC where cilia are labeled with GFP in Tg (?-actin:Arl13b-GFP) transgenic embryos (B1) used to draw a map of local main beating frequency (B2) from the fluorescence signal obtained by calculating the local Fourier transform. Regions of constant frequency are color-coded and most likely correspond to single cilium beating. (C1) Scheme presenting some parameters of interest extracted from regions of constant frequency obtained in (B2) and fitted as ellipses to obtain their mean orientation ?, their major axis (L), associated with the cilia maximal length, and their height (h), that is their projection along the D-V axis. The latter parameter gives the portion of central canal occupied by beating cilia. (C2, C3, C4) Histograms of parameters extracted in many regions of constant frequency of n = 89 Tg(?-actin: Arl13b-GFP) 30 hpf embryos, for a total of 1704 motile cilia (298 dorsal cilia and 1406 ventral cilia) analyzed in total. A central frequency of 38.1 Hz (median frequency with s.d 10.0 Hz) (C2), a mean absolute orientation |?| 62.6° (s.d. 23.4°) (c3), a length L of 5.8 ?m (s.d. 2.0 ?m) (C4) as well as a beating height of 2.7 ?m (s.d. 1.9 ?m) (not shown) were found for ventral cilia. Dorsal motile cilia have a central frequency of 32.3 Hz ± 12.3 Hz, a caudal orientation of absolute value 59.7°± 25.8° and a length of 5.5 ?m ± 3.0 ?m. Scale bar is 50 ?m in (A1), and 15 ?m in (A2, B1, B2). |
|
( |
|
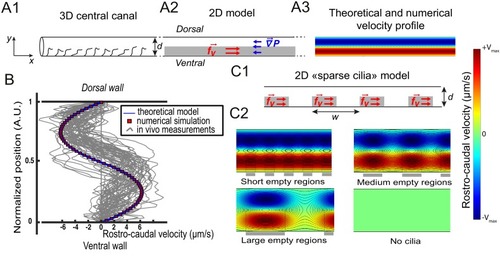
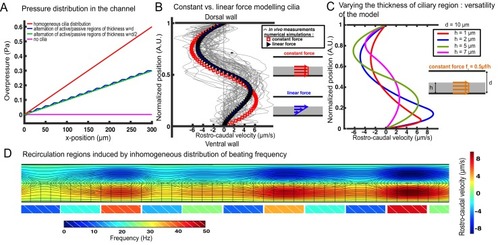
Theoretical and numerical results explain how motile cilia generate local CSF flow in 30 hpf embryos. (A1) Schematic of the three-dimensional central canal that can be reduced to a quasi-cylinder whose ventral wall is paved by regularly positioned motile cilia, and whose dorsal wall is composed of more loosely distributed passive cilia. (A2) The model reduces the geometry to a bidimensional channel of thickness d, composed of two main regions occupying the ventral and dorsal halves of the channel. In the ventral region, the cilia contribution is modeled as a constant bulk force. A constant gradient of pressure, present in the whole central canal, opposes the cilia-induced force and ensures a global zero flux on a cross section. (A3) Numerically and theoretically calculated velocity maps, where dark blue represents highest rostral velocities (negative values), while dark red holds for the highest caudal velocities (positive values). (B) Numerical (red squares) and theoretical (blue line) velocity profiles, composed of two parabolas matched at the center of the cross-section (Relative position = 0.5). They are convincingly compared to a superimposition of in vivo measurements obtained on 57 WT siblings. (C1) ?Sparse cilia? model, accounting for the spatially inhomogeneous defects in cilia structure or motility (as observed in some mutants with defective cilia). The model reduces these defects to regions in the ventral side that are fully passive and where no force applies. Numerical simulations enable to derive the flow with an arbitrary distribution of these passive regions. (C2) Maps of characteristic streamlines obtained for various aspect ratios w/d of the repeat units. Small passive regions show most of the streamlines parallel to the walls. A central recirculation, or vortex, is gradually more present in between cilia regions as the lateral extension of the passive region increases. The corresponding distribution of pressure in the central canal for these different cases is represented in Figure 3?figure supplement 1. |
|
( |
|
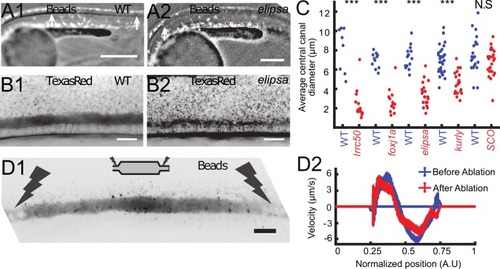
Cilia beating controls long-range transport, CC architecture, and local flow in zebrafish embryos. (A1, A2) Progression of 20 nm fluorescent beads inside the CC 2 hr post injection (two hpi) in the diencephalic/mesencephalic ventricle in a WT 30 hpf embryo (A1) and in a ciliary mutant (elipsa) sibling (A2). The progression front is demarcated by the rightmost white arrow in (A1) and (A2), showing that beads barely propagate in central canal in ciliary mutants. (B1, B2) Central canal geometry in a WT embryo (B1) and in a ciliary mutant (elipsa) sibling (B2). The central canal was filled with Texas Red, and is displayed as the maximal projection image from a Z-stack of 30 images around CC. The CC appears collapsed in an elipsa mutant. (C) Quantification of CC diameter for different ciliary mutants (lrrc50, foxj1a, elipsa, kurly) and one curled down mutant with intact CSF flow (SCO) (red dots, right side) versus their WT siblings (blue dots, left side). (D1) Time average image of 20 nm fluorescence beads in inverted contrast of a central canal region where photoablation was performed on both sides (dark lightning bolt), closing the canal. (D2) Quantification of local CSF flow in the CC region in (D1) before (blue) and after (red) photoablation. CC geometry remains intact in the central region (D1), as well as the flow profile (D2). Scale bars represent 200 ?m in (A1, A2), and 15 ?m in panels (B1, B2, D1). P-values in (C) are respectively 2.2 10?6, 3.1 10?9, 3.5 10?6 1.82 10?8, 0.096 from left to right. The values for control WT siblings from all experiments are not statistically different. PHENOTYPE:
|
|
( PHENOTYPE:
|
|
( |
|
( |
|
( |
|
( |

