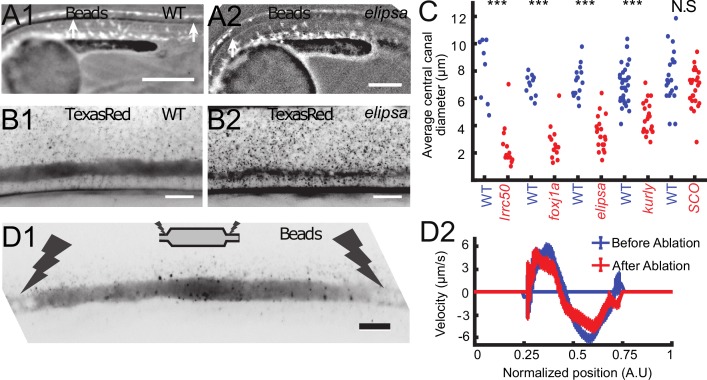
Figure 4 Cilia beating controls long-range transport, CC architecture, and local flow in zebrafish embryos. (A1, A2) Progression of 20 nm fluorescent beads inside the CC 2 hr post injection (two hpi) in the diencephalic/mesencephalic ventricle in a WT 30 hpf embryo (A1) and in a ciliary mutant (elipsa) sibling (A2). The progression front is demarcated by the rightmost white arrow in (A1) and (A2), showing that beads barely propagate in central canal in ciliary mutants. (B1, B2) Central canal geometry in a WT embryo (B1) and in a ciliary mutant (elipsa) sibling (B2). The central canal was filled with Texas Red, and is displayed as the maximal projection image from a Z-stack of 30 images around CC. The CC appears collapsed in an elipsa mutant. (C) Quantification of CC diameter for different ciliary mutants (lrrc50, foxj1a, elipsa, kurly) and one curled down mutant with intact CSF flow (SCO) (red dots, right side) versus their WT siblings (blue dots, left side). (D1) Time average image of 20 nm fluorescence beads in inverted contrast of a central canal region where photoablation was performed on both sides (dark lightning bolt), closing the canal. (D2) Quantification of local CSF flow in the CC region in (D1) before (blue) and after (red) photoablation. CC geometry remains intact in the central region (D1), as well as the flow profile (D2). Scale bars represent 200 ?m in (A1, A2), and 15 ?m in panels (B1, B2, D1). P-values in (C) are respectively 2.2 10?6, 3.1 10?9, 3.5 10?6 1.82 10?8, 0.096 from left to right. The values for control WT siblings from all experiments are not statistically different.
Image
Figure Caption
Figure Data
Acknowledgments
This image is the copyrighted work of the attributed author or publisher, and
ZFIN has permission only to display this image to its users.
Additional permissions should be obtained from the applicable author or publisher of the image.
Full text @ Elife

