- Title
-
Extracellular ATP hydrolysis inhibits synaptic transmission by increasing ph buffering in the synaptic cleft
- Authors
- Vroman, R., Klaassen, L.J., Howlett, M.H., Cenedese, V., Klooster, J., Sjoerdsma, T., Kamermans, M.
- Source
- Full text @ PLoS Biol.

ZFIN is incorporating published figure images and captions as part of an ongoing project. Figures from some publications have not yet been curated, or are not available for display because of copyright restrictions. PHENOTYPE:
|
|
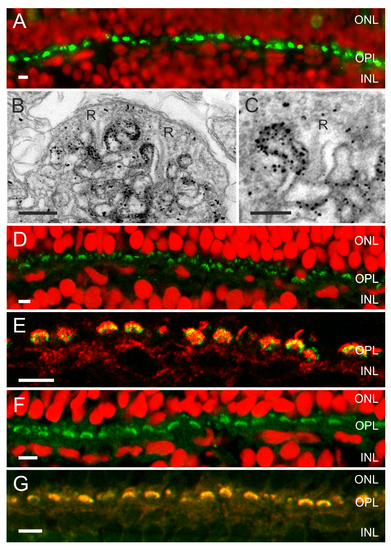
An ATP release mechanism and the enzymes needed to hydrolyze ATP and degrade adenosine are present in the synaptic complex of cones. (A) Fluorescent images of zebrafish retina showing Panx1-IR (green) and a nuclear stain (red) (from Prochnow et al. [11]). Panx1-IR is present in characteristic horseshoe-shaped structures indicative for processes invaginating the cone synaptic terminal. (B) Electronmicrograph of a cone synaptic terminal in zebrafish retina. Immunolabeling is restricted to HC dendrites flanking the synaptic ribbons (R). (C) Higher magnification of a HC dendrite lateral of the synaptic ribbon (R). Note that one HC dendrite is devoid of Panx1 labeling. (D) NTPDase1-IR (green) and a nuclear stain (red). NTPDase1-IR is also present in horseshoe-shaped structures characteristic for localization in HC dendrites. (E) Double labeling of NTPDase1 antibody with an antibody against GluR2 (green), a marker for HC dendrites [63],[64], indicated that NTPDase-1 (red) was specifically expressed on HC dendrites. (F) ADA-IR (green) was present in horseshoe-shaped structures. (G) ADA-IR colocalized with the GluR2-IR (green), indicating that ADA (red) is expressed on HC dendrites. Expression of ecto-ATPases in the photoreceptor synaptic terminal has been observed previously in rat [39], mouse, and zebrafish [61]. Scale bars in panels A, D, E, F, and G indicate 5 µm. Scale bar in panels B and C indicate 500 nm and 250 nm, respectively. EXPRESSION / LABELING:
|
|
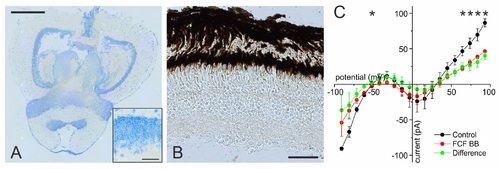
To rule out possible other effects of probenecid than inhibiting Panx1, we investigated the presence of organic anion transporters (OATs) in the retina. The only other proteins known to be inhibited by probenecid are OATs [67]. OAT1 is expressed in the brain [68], but retinal expression in fish has not been assessed. To test whether this transporter is also expressed in the retina, we performed an in situ hybridization (ISH) experiment. Here we show with ISH of a probe directed to OAT1 that the OAT1 was expressed in various places in the brain. (A) Horizontal slice through the zebrafish brain at the level of the telencephalon and mesencephalon. The blue reaction product is widely present. Note for instance the restricted presence of reaction product in a layer in the tectum opticum. Scale bar, 500 µm. Images were acquired with a 20× objective and an Evolution MP Color camera (Media Cybernetics, Rockville, USA) connected to an Axioskop light microscope (Zeiss, Göttingen, Germany) and stitched together with Image Pro 6.3. The insert in panel (A) shows that the label is exclusively present in the cellular compartments. Scale bar for the insert is 25 µm. No reaction product was found in the inner and outer nuclear and ganglion cell layers of the zebrafish retina (B). Scale bar, 50 µm. Thus, probenecid can be considered a specific Panx1 inhibitor in the retina, as its actions are not mediated via an OAT1 pathway. (C) The mean whole-cell IV relations of four dissociated HCs in control conditions (black) and when the Panx1 current was blocked with 20 µM BB FCF (red). During the whole experiment, potassium currents were inhibited by Cs. The green trace is the IV relation of the BB FCF blocked current. This current has the similar characteristics as the Panx1 current described by Prochnow et al. [11]. Both (B) and Figure S3C demonstrate current flows via Panx1 channels within the physiological membrane potential range. Methods ISH: Zebrafish brain and eyes were isolated and fixed in 4% formalin solution for 2 h, treated with a sucrose solution to prevent ice crystal formation in storage, and fixed for another 24 h in 25% paraformaldehyde (PFA). The tissue was embedded in Tissue-Tek and frozen. Cryostat sections of 10 µm were collected with a Leica CM 3050 S cryostat (Leica Biosystems, USA) and stored at ?80°C. For ISH, sections were stored at ?80°C. Hybridization was performed using OAT1-specific, 5?-fluorescein-labeled 25 mer antisense oligonucleotides containing locked nucleic acid (LNA) (base uppercase) and 2?-O-methyl (2OME)-RNA moieties (base lowercase); OAT1-1 (5?-Fam/TagTagGcaAagCtgGtgCtgGagA-3?). Probes were synthesized by Exiqon (Odense, Denmark). Hybridization signals were detected by incubating the sections in blocking buffer containing anti-fluorescein-alkaline phosphatase (AP) Fab fragments (1?1,000; Roche, Lewes, UK) for 1 h at room temperature. AP signal was detected by using a substrate kit (Vector Blue AP Substrate Kit III; Vector, Burlingame, CA). |


