- Title
-
A 3D Searchable Database of Transgenic Zebrafish Gal4 and Cre Lines for Functional Neuroanatomy Studies
- Authors
- Marquart, G.D., Tabor, K.M., Brown, M., Strykowski, J.L., Varshney, G.K., LaFave, M.C., Mueller, T., Burgess, S.M., Higashijima, S., Burgess, H.A.
- Source
- Full text @ Front. Neural Circuits
|
Average brain representations of Gal4 enhancer trap lines. Maximum projections through 80 Gal4 enhancer trap lines that were imaged, registered and averaged for this study. Gal4 expression was visualized using the UAS:Kaede transgenic line (magenta). Each panel is the average of at least three brains. For contrast, each panel also shows ubiquitous ▓actin:Switch expression (gray) and pan-neuronal HuC:Cer expression (blue, after application of brain mask). Scale bar (bottom right panel) 100 Ám. |
|
Brain browser software for searching enhancer trap lines. The browser displays horizontal (A), transverse (or oblique), (B) and sagittal (C) views of user-selected image stacks of transgenic and enhancer trap lines. The browser displays single brain slices (B,C), using cross-hairs to indicate the slice location in orthogonal planes (e.g., dotted line in C shows the position of the transverse view in B). Alternatively, maximum projections of selected regions can be visualized (A, between the region indicated by dotted lines in B) or a 3D projection of the whole brain (D). The control panel (F) lists all lines in the database and during searches, indicates lines (orange box) that label selected 3D regions of interest (E) or neuroanatomical structures. Information on the transgene integration site and neuroanatomical annotation are available in an additional panel (G), which also contains epifluorescent images for all Gal4 enhancer trap lines (H). |
|
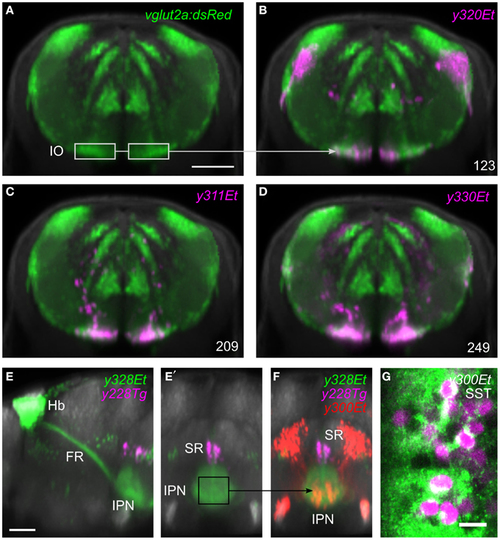
Region of interest search with the brain browser. (A) Transverse view through caudal medulla of vglut2a:DsRed average brain (green). The boxed regions were used to draw a region of interest around the inferior olive (IO) to search the database for Gal4 lines labeling IO neurons. Scale bar 50 Ám. (B-D) The three Gal4 enhancer trap lines that most strongly matched the search area (magenta). Each line contained neurons in the region of the IO. (E) Sagittal and (E′) transverse projections of line y328Et (green) which labels the habenula (Hb) and fasciculus retroflexus (FR) including termination zone in the interpeduncular nucleus (IPN). For orientation, a line labeling the superior raphe (SR) is also shown (y228Tg, magenta). The termination zone of habenula neurons in the IPN was used to create a 3D search region. Scale bar 50 Ám. (F) Brain browser image showing the result of the 3D search: enhancer trap line y300Et (red) which contained strongly fluorescent cell bodies within the IPN. (G) Single confocal plane showing immunostaining against somatostatin (SST, green) and transgene expression in y300Et (Kaede fluorescence, magenta) within the IPN. Scale bar 10 Ám. |
|
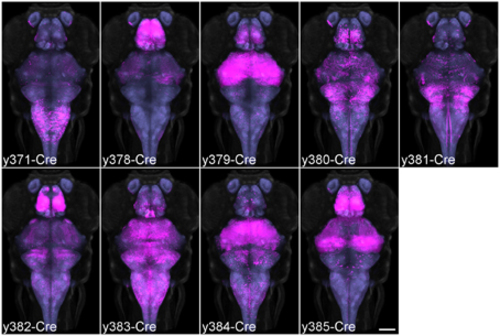
Average brain representations of Cre enhancer trap lines. Maximum projections through the 9 Cre enhancer trap lines imaged for this study. Each line was visualized using the βactin:Switch transgenic line and scanned with HuC:Cer in order to register the pattern to the database. At least three brains were scanned and averaged for each line (magenta). Background: ubiquitous βactin:Switch (gray) and pan-neuronal HuC:Cer (blue, after brain mask applied). Scale bar 100 Ám. |
|
Intersectional control of reporter gene expression in neurons expressing both Gal4 and Cre. (A) Expression patterns of y252-Gal4 and y371-Cre superimposed using the brain browser. Scale bar 100 Ám. (B) Predicted region of co-expression for y252 and y371 based on co-localization of strongly fluorescent pixels (red). (C) Actual region of co-expression of Gal4 and Cre in y252-Gal4, y371-Cre, UAS:GR-Switch embryos. Both predicted and actual expression is primarily confined to the median and caudal medulla. (D-F) Similar analysis using y252-Gal4 and y385-Cre in which very strong Cre expression is detected in the forebrain, and weaker Cre expression is observed in the medulla. Both predicted and actual expression is seen in these regions, along with sparse labeling in additional brain regions. |
|
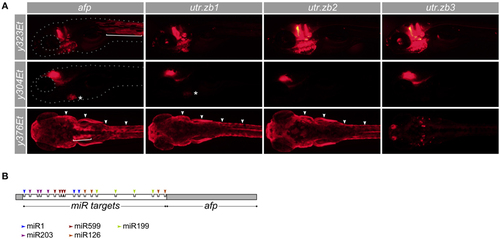
Suppression of non-neuronal expression using synthetic 3′ untranslated regions. (A) Development of synthetic utr-zb3 for suppressing Gal4 reporter expression in muscle, skin and heart. We used Gal4 enhancer trap lines y323Et, y304Et, and y376Et to drive expression in muscle (bracket), heart (asterisk), and skin (arrowheads) respectively-each of these lines also drives expression in the brain. The full pattern of expression is seen using a UAS:epNTR-TagRFPT reporter which has a standard ocean pout anti-freeze protein (afp) 3′ UTR (left panels). Replacing the afp with utr-zb1 eliminates muscle but not heart or skin expression. Similarly utr-zb2 additionally eliminates cardiac expression and utr-zb3 suppresses expression in muscle, heart and skin. (B) Schematic of the 3′ untranslated region in utr-zb3. MicroRNA sites are placed at the beginning of the 3′ UTR, ahead of the afp sequence. |
|
Assessing registration accuracy by colocalized Gal4 reporter gene expression. Dorsal (A) and transverse (B) views of brain browser projections for enhancer trap line y264Tg (green) and transgenic line j1229aGt (magenta) in the region including the Mauthner cells (arrowheads). (C,C′) Dorsal view of maximum projection of average representations of y339Et, made from two independent sets of three embryos each. Dotted line shows location of transverse slice shown in (D). (D) Slice through the midbrain and diencephalon of superimposed y339Et averages. In the right optic tectum, a neuropil layer (arrows) in the averages is misaligned by 1-2 cell diameters. (E) Horizontal view of a slice through the hindbrain from HuC:Cer average brain. Arrowheads indicate gaps in the tissue lacking neuronal Cer expression. flk:GFP expression, which labels blood vessels, is superimposed in (F). Anterior (A), Posterior (P), Dorsal (D), Ventral (V). All scale bars 50 Ám. |
|
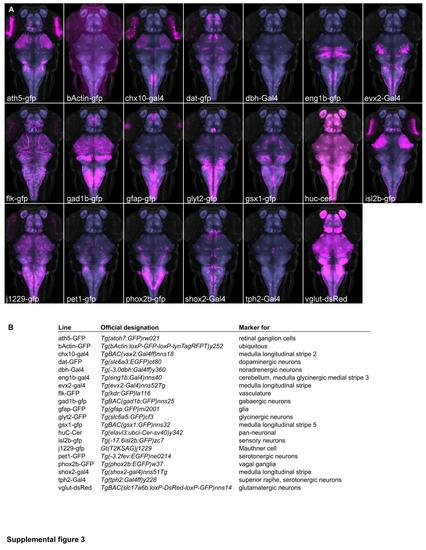
Transgenic lines providing neuroanatomical markers. Maximum projections (A) and expression domains (B) of transgenic lines that were imaged as part of this study. Gal4 lines were visualized using UAS:GFP (magenta). Background: ubiquitous βactin:Switch (gray) and pan-neuronal HuC:Cer (blue, after brain mask applied). |
|
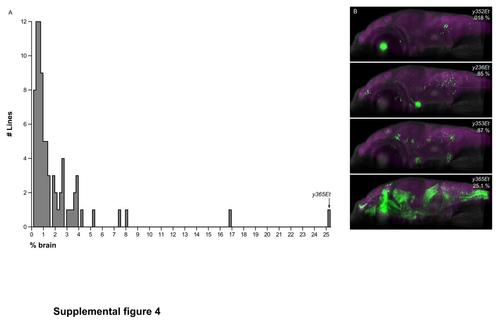
Extent of brain expression in Gal4 enhancer trap lines. (A)Histogram of the extent of brain coverage for the 80 Gal4 enhancer trap lines imaged in this study.(B) Sagittal hemi-projection for the line with the most restricted Gal4 expression pattern y352Et, for two lines with close to the median extent of Gal4 expression (y236Et and y353Et) and for the line with the broadest Gal4 expression pattern included in the database, y365Et. |
|
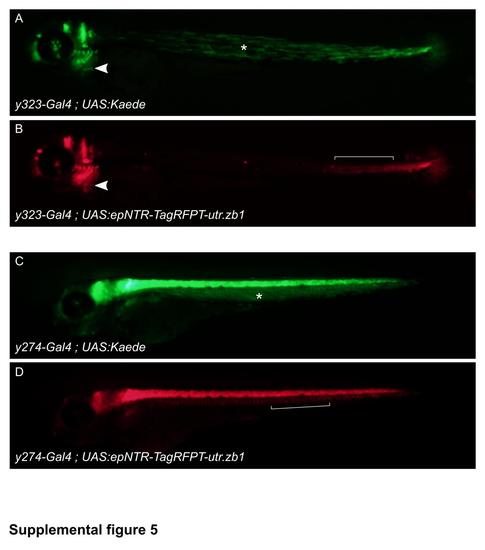
Synthetic 3′ UTR utr.zb1 suppresses transgene expression in muscle. The synthetic 3′ untranslated region utr.zb1 reduces expression in both slow and fast muscle, but not in heart or notochord. Epifluorescence from Kaede (green) and TagRFPT (red) iny323- Gal4, UAS:Kaede, UAS:epNTR-TagRFPT-utr.zb1 (A,B) or y274-Gal4, UAS:Kaede, UAS:epNTR-TagRFPT-utr.zb1 (C,D) embryos imaged at 3 dpf. In y323Et, Gal4 is expressed outside the brain in slow muscle, notochord, heart and caudal fin. Slow muscle (A, asterisk) expression is suppressed by utr.zb1 but expression in notochord (B, bracket), heart (arrowhead), and caudal fin remains intact. Similarly expression of Gal4 in fast muscle is suppressed by utr.zb1in y274Et (C, asterisk), but notochord expression (D, bracket) is not diminished. |


