- Title
-
A zebrafish jam-b2 Gal4-enhancer trap line recapitulates endogenous jam-b2 expression in extraocular muscles
- Authors
- Matsui, H., Dorigo, A., Buchberger, A., Hocking, J.C., Distel, M., K÷ster, R.W.
- Source
- Full text @ Dev. Dyn.
|
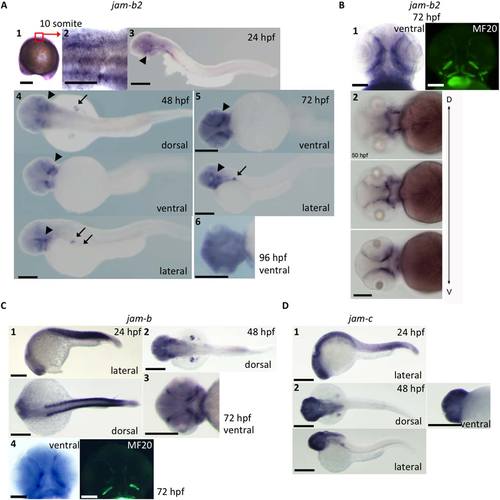
jam-b2 mRNA expression in zebrafish larvae. A1: jam-b2 is expressed ubiquitously at the 10 somite stage (scale bar = 200 Ám). A2: High magnification image of A1 (scale bar = 100 Ám). A3?A5: jam-b2 expression is identified in pectoral fins (arrow) and in cranial tissues (arrowhead) during 24?72 hr postfertilization (hpf; scale bar = 200 Ám). A6: jam-b2 expression in EOMs and jaw muscles disappears at around 96 hpf (scale bar = 200 Ám). B1: The signals detected in the cranial part represent EOMs and jaw muscles. Figures from the same embryo is presented. MF20: muscle specific antibody (scale bar = 100 Ám). B2: jam-b2 expression at different focus along the dorsal?ventral axis. Figures are indicated from dorsal [D] to ventral [V] (scale bar = 200 Ám). C1?C3: jam-b expression is identified in somites / myotomes, pectoral fins and cranial tissue during 24?72 hpf (scale bar = 200 Ám). C4: The signals detected in the cranial part represent EOMs and jaw muscles. Figures from the same embryo is presented. MF20: muscle specific antibody (scale bar = 100 Ám). D1?D2: jam-c expression is rather ubiquitous and does not show clear signals in muscles / myotomes compared with jam-b or jam-b2 (scale bar = 200 Ám). EXPRESSION / LABELING:
|
|
Transactivation of EGFP expression by jamb2bz1Et enhancer trap line in EOMs, jaw muscles, and pectoral fins. A: Schematic illustration of the chromosomal KalTA4 insertion locus in the jamb2bz1Et enhancer trap line. KalTA4 was inserted by Gal4 enhancer trapping into chromosome 9: base pairs 35,967,033 to 35,967,039. This site locates 544 base pairs upstream of the jam-b2 open reading frame. B: EGFP signal at 1 dpf. Note that the expression in the notochord (and some nonneuronal spinal cord cells at 3 dpf, Fig.2E) is due to the twhh promoter sequence used as basal promoter in front of KalTA4 in the trapping construct (Distel et al., 2009; scale bar = 250 Ám). C,D: EGFP fluorescence at 2 dpf. jam-b2 enhancer mediated KalTA4-expression drives EGFP expression in EOMs (C, arrowhead) and pectoral fins (D, arrow; scale bar = 150 Ám). E,F: EGFP signal at 3 dpf. Arrowhead: EOMs. Arrow: pectoral fins (E: scale bar = 500 Ám, F: scale bar = 200 Ám). G: Schematic illustration of EOMs in zebrafish. LR: lateral rectus, MR: medial rectus, SO: superior oblique, IO: inferior oblique, SR: superior rectus, IR: inferior rectus. H: Colocalization of EGFP signals with the signals of MF20 muscle specific antibody. For comparison, in situ signal shown in Figure 1B1 is again presented on the left (scale bar = 200 Ám). EXPRESSION / LABELING:
|
|
Representative figures from confocal 3D reconstruction. A: Representative figures of Movie 1 and schematic illustration of EOMs (5 dpf). B: Representative figures of Movie 2 and schematic illustration of EOMs (5 dpf). C: Confocal 3D reconstruction images of EOMs at 9 dpf. The EGFP signals has gradually decreased and disappeared in adult fish (data not shown). |
|
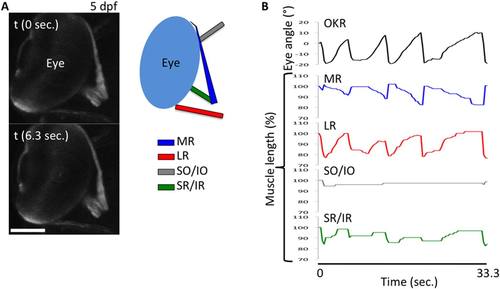
Simultaneous monitoring of EOMs and eye movement during horizontal OKR. jam-b2:KalTA4 - UAS:mCherry fish are used. A: Representative images of EOMs signals at 5 dpf. LR, lateral rectus; MR, medial rectus; SO, superior oblique; IO, inferior oblique; SR, superior rectus; IR, inferior rectus; OKR, optokinetic response. B: Quantitative measurements of eye movement and EOMs length. Number of fish = 3. One representative graph is shown. |

Unillustrated author statements EXPRESSION / LABELING:
|


