- Title
-
The SLC7A7 Transporter Identifies Microglial Precursors prior to Entry into the Brain
- Authors
- Rossi, F., Casano, A.M., Henke, K., Richter, K., Peri, F.
- Source
- Full text @ Cell Rep.
|
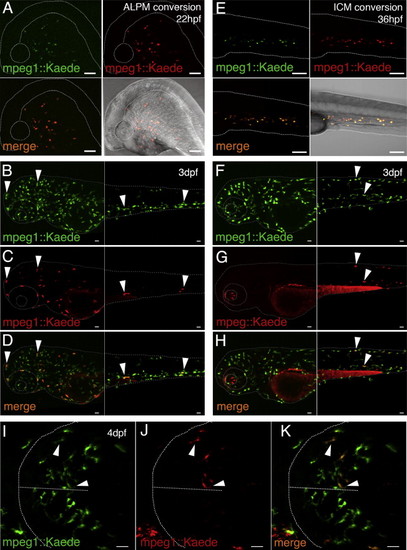
Microglia Derive from ALPM Yolk-Sac Macrophages with No Contribution from the ICM (A) Photoconversion of ALPM macrophages. Side views of a 22-hpf photoconverted embryo (mpeg1::Kaede) are shown (top left, Kaede green; top right, Kaede red; bottom left, overlay of green and red; bottom right, overlay with bright field). (B?D) Side view shows a 3-day-post-fertilization embryo previously photoconverted at 22 hpf (B, Kaede green; C, Kaede red; D, overlay). (E) Photoconversion of ICM macrophages. Side views of a 36-hpf photoconverted embryo (mpeg1::Kaede) are shown (arranged as in A). (F?H) Side view shows a 3-day post-fertilization embryo previously photoconverted at 36 hpf (F, Kaede green; G, Kaede red; H, overlay). Red labeling in the eye is due to autofluorescence of the sample. (I?K) Dorsal view shows a 4-day-post-fertilization embryonic brain previously photoconverted at 22 hpf in the ALPM region (I, Kaede green; J, Kaede red; K, overlay). Dotted line indicates the shape of the brain and the two hemispheres. White arrowheads indicate Kaede+ cells showing both green and red emission. Scale bars for all images, 50 Ám. See also Figure S1. EXPRESSION / LABELING:
|
|
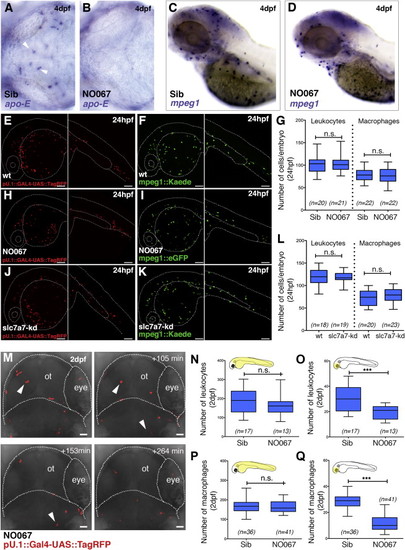
Characterization of the NO067 Zebrafish Mutant (A and B) WISH for apo-E in a sibling (A) and NO067 mutant (B) brain at 4 days post fertilization is shown. White arrows indicate apo-E+ microglia. (C and D) WISH for mpeg1 in a sibling (C) and NO067 mutant (D) embryo at 4 days post fertilization is shown. (E, H, and J) Lateral view shows a representative pU1::TagRFP wild-type (E), mutant (H), and slc7a7 morphant (J) at 24 hpf. (F, I, and K) Lateral view shows a representative mpeg1::Kaede wild-type (F), mpeg1::Kaede morphant (K), and mpeg1::eGFP mutant (I) at 24 hpf. (G and L) Numbers of leukocytes and macrophages in siblings and mutants (G) and wild-type and slc7a7 morphants (L) at 24 hpf are shown. (M) Representative time-lapse images show two leukocytes undergoing apoptosis within the head region of a NO067;pU.1::TagRFP embryo (white arrowheads). Dotted line indicates the shape of the head and the eye. (N?Q) Numbers of leukocytes (N and O) and macrophages (P and Q) in siblings and mutants in the head (N and P) and rest of the body (O and Q) at 2 days post fertilization are shown, as indicated in yellow in the schematics. p < 0.0005, Mann-Whitney test. Scale bars for all images, 25 Ám. Sib, sibling; n, number of embryos. See also Figures S2 and S3 and Movie S1. |
|
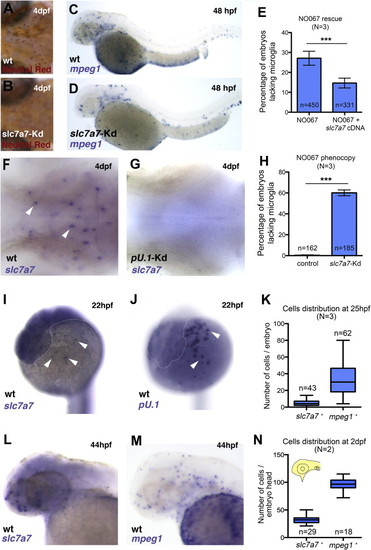
Slc7a7 Is Expressed in Microglia and a Monocyte Sub-lineage at Early Developmental Stages (A and B) Neutral red staining shows a representative wild-type (A) and slc7a7 morphant (B) embryo at 4 days post fertilization, with a lack of microglia in the slc7a7 morphant brain. (C and D) WISH for mpeg1 in a wild-type (C) and a slc7a7 morphant (D) embryo at 2 days post fertilization. Slc7a7 morphants lack macrophages in the brain and in the eyes. (E) Rescue of the NO067 phenotype. Percentages of homozygous NO067 embryos lacking microglia at 4 days post fertilization, with or without expression of the UAS::slc7a7 cDNA, are given. Error bars show SEM. p < 0.001, Fisher?s exact test. (F and G) WISH for slc7a7 in the brain of a wild-type (F) and a pU.1 morphant (G) embryo at 4 days post fertilization (dorsal views). Slc7a7+ cells are absent in pU.1 morphants, indicating that they have a myeloid origin. White arrowheads indicate slc7a7+ cells. (H) Phenocopy of the NO067 phenotype. Percentages of 4-day-post-fertilization embryos lacking microglia in control and slc7a7 morphant embryos are given. Error bars show SEM. p < 0.001, Fisher?s exact test. (I and J) WISH for slc7a7 (I) and pU.1 (J) in a wild-type embryo at 22 hpf. White arrowheads indicate slc7a7+ and pU.1+ cells, respectively. Dotted line indicates the shape of the head. (K) Numbers of slc7a7+ cells and mpeg1+ cells at 25 hpf are given. (L and M) WISH shows 2-day-post-fertilization wild-type embryos stained with slc7a7 (L) and mpeg1 (M). (N) Numbers of slc7a7+ cells and mpeg1+ cells at 2 days post fertilization are given. N, number of experiments; n, number of embryos. See also Figure S4. EXPRESSION / LABELING:
|
|
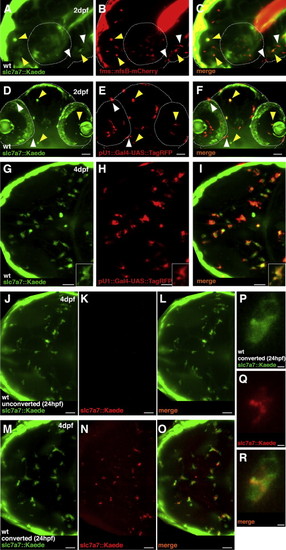
Slc7a7+ Cells Give Rise to Microglia in the Brain (A?C) Lateral view shows a representative slc7a7::Kaede;fms::nfsB-mCherry embryo at 2 days post fertilization; slc7a7+ cells (A, green, slc7a7::Kaede), macrophages (B, red, fms::nfsB-mCherry), and overlay (C) are shown. Few cells are both fms+ and slc7a7+ (yellow arrowheads). White arrowheads indicate fms+ cells only. (D?F) Frontal view shows a representative slc7a7::Kaede;pU.1::TagRFP embryo at 2 days post fertilization. Slc7a7+ cells (D, green, slc7a7::Kaede), leukocytes (E, red, pU.1::TagRFP), and overlay (F) are shown. Few cells are both pU.1+ and slc7a7+ (yellow arrowheads). White arrowheads indicate pU.1+ cells only. (G?I) Dorsal view shows a slc7a7::Kaede;pU.1::TagRFP embryo at 4 days post fertilization. Microglia are both slc7a7+(G) and pU.1+ (H), with overlay (I) and a representative microglia (inset) shown. (J?O) Dorsal view shows a 4-day-post-fertilization slc7a7::Kaede embryo not photoconverted (J?L) and photoconverted at 24 hpf (M?O) (Kaede green, J and M; Kaede red, K and N; overlay, L and O). (P?R) Representative example of a photoconverted microglia is shown. Scale bars for all images, 25 Ám. See also Figure S4. |
|
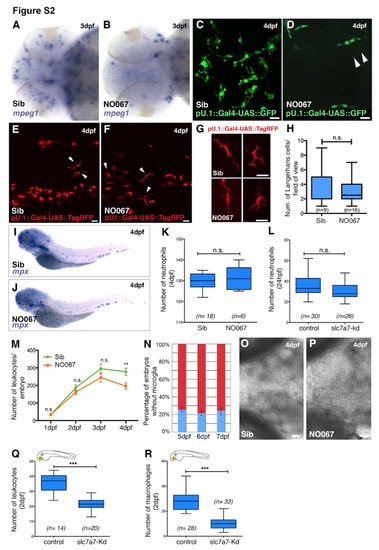
The NO067 phenotype is specific for microglia. Related to Figure 2. (A and B) Dorsal view of 3 dpf sibling (A) and NO067 mutant brain (B) stained with an antisense mpeg1 RNA probe. (C and D) Dorsal view of a representative pU.1::GFP sibling (C) and NO067 mutant (D) brain at 4 dpf . NO067 lacks microglia but retains circulating monocytes (white arrowheads).(E and F) Representative region of the superficial layers of the trunk in a sibling (E) and a NO067 mutant (F) at 4 dpf. White arrowheads indicate Langerhans cells expressing TagRFP (pU.1:: TagRFP). (G) Representative Langerhans cells in a 4 dpf embryo. There are no morphological differences between sibling cells (top panels) and mutant cells (bottom panels). (H) Quantifications of the number of Langerhans cells within the region of interest (as shown in E and F). (I and J) WISH for mpx in a sibling (I) and a NO067 mutant (J) embryo at 4 dpf (side view). (K) Quantifications of the number of neutrophils (mpx) in siblings and mutants at 4 dpf. (L) Quantifications of the number of neutrophils (mpx) in wild type and morphants at 24 hpf. (M) Quantifications of the number of leukocytes in siblings (green line) and NO067 homozygous mutants (orange line). **p<0.005. Mann-Whitney test. (N) Percentage of embryos lacking microglia (blue bars) in clutches derived from crossing NO067 heterozygotes parents. Error bars show SEM. (O and P) Representative examples of sibling (O) and mutant (P) brains at 4 dpf (brightfield, dorsal view). In the absence of microglia apoptotic corpses accumulate in the mutant brain. (Q and R) Quantifications of the number of leukocytes (Q) and macrophages (R) in the head of wild-type and slc7a7 morphant embryo. ***p<0.0005. Mann-Whitney test. Scale bars for all images: 25 μm. Sib, sibling. n=num. of embryos. |
|
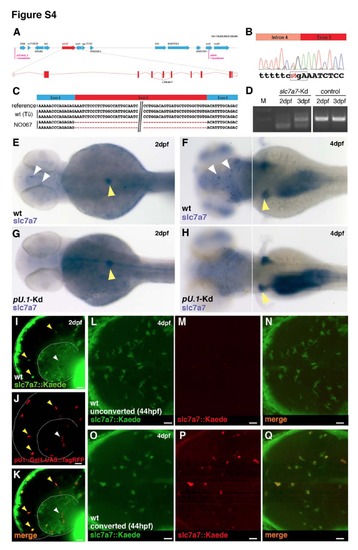
Slc7a7 is expressed in anteriorly located macrophages and is necessary for the establishment of the microglial population. Related to Figure 3 and Figure 4. (A) Genetic map of the NO067/slc7a7 locus. (B and C) Sequence chromatogram showing the mutation in the slc7a7 coding sequence (ENSDARG00000055226). Sequence analysis identifies an A to T mutation in the fourth splice acceptor of slc7a7 (B) that leads to skipping of the fifth exon (C). Box in (B) indicates the premature stop codon. (D) RT-PCR analysis using primers flanking the exon5 of the slc7a7 cDNA to confirm the efficacy of the morpholino-mediated knockdown. A band shift is present both at 2 and 3 dpf in injected embryos. (E-H) WISH for slc7a7 in a wildtype (E-F) and a pU.1 morphant (G-H) embryo at 2 dpf and 4 dpf (dorsal view). Knockdown of pU.1 leads to lack of slc7a7+ cells in the head (white arrowheads) but not in pancreas and kidney (yellow arrowheads). (I-K) Lateral view of a representative slc7a7::Kaede;pU.1::TagRFP embryo at 2 dpf. Slc7a7+ cells are in green (I, slc7a7::Kaede) and leukocytes are in red (J, pU.1::TagRFP), (K) overlay. Few cells are both pU.1+ and slc7a7+ (yellow arrowheads). White arrowheads indicate pU.1+ cells only. (L-Q) Dorsal view of a representative brain of a 4 dpf slc7a7::Kaede transgenic embryo not photoconverted (L-N) and photoconverted at 44 hpf (O-Q). (L and O) Kaede green, (M and P) Kaede red, (N and Q) overlay. Scale bars for all images: 25 μm. |

